Getting Started
Starting the Kinetics Neo Software
Starting the Kinetics Neo Software
After installation of the NETZSCH Kinetics Neo software, the icon

appears on the desktop and also in the group NETZSCH / Kinetics in the start menu.
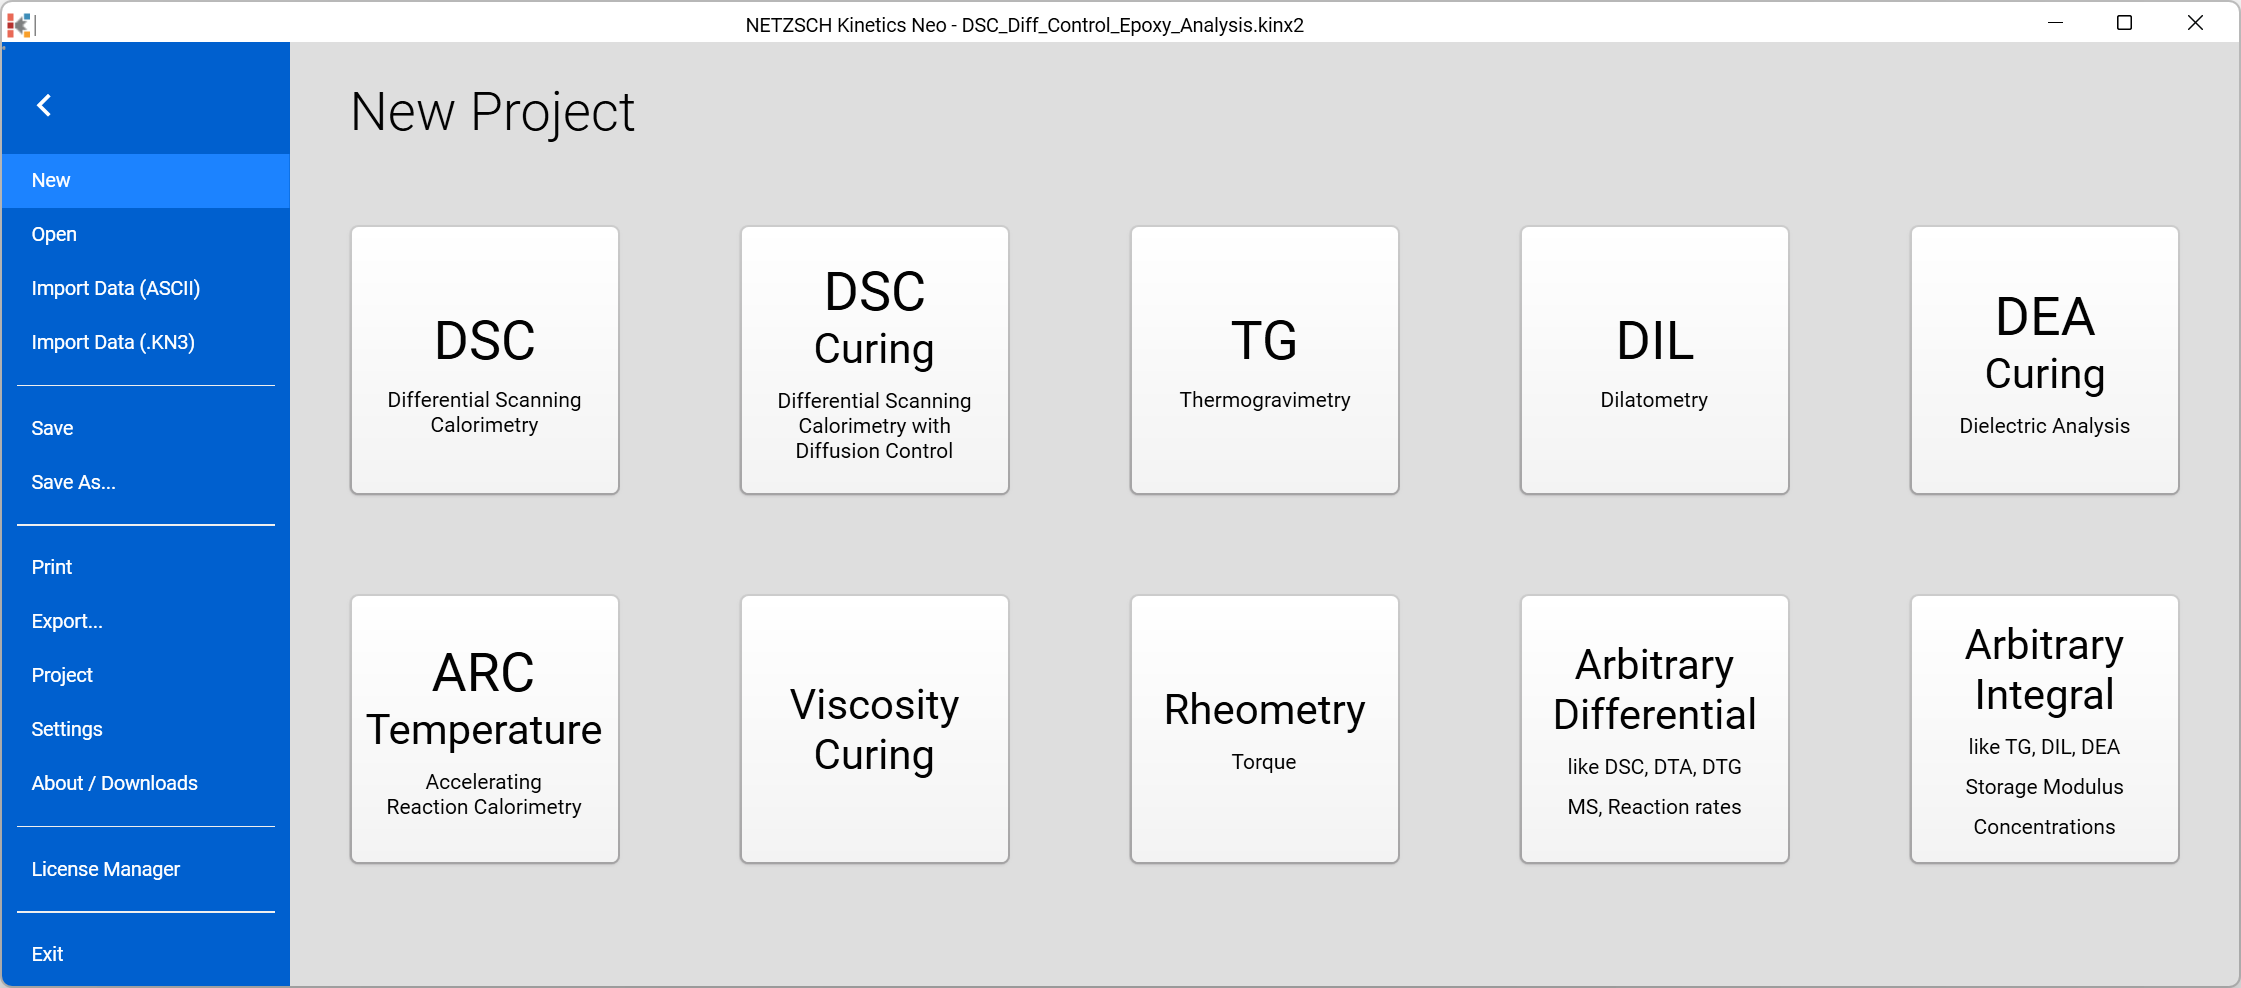
After starting the software, the following main view can be seen:
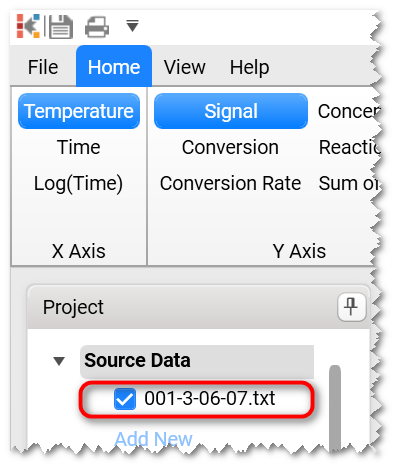
Selecting the Data Type
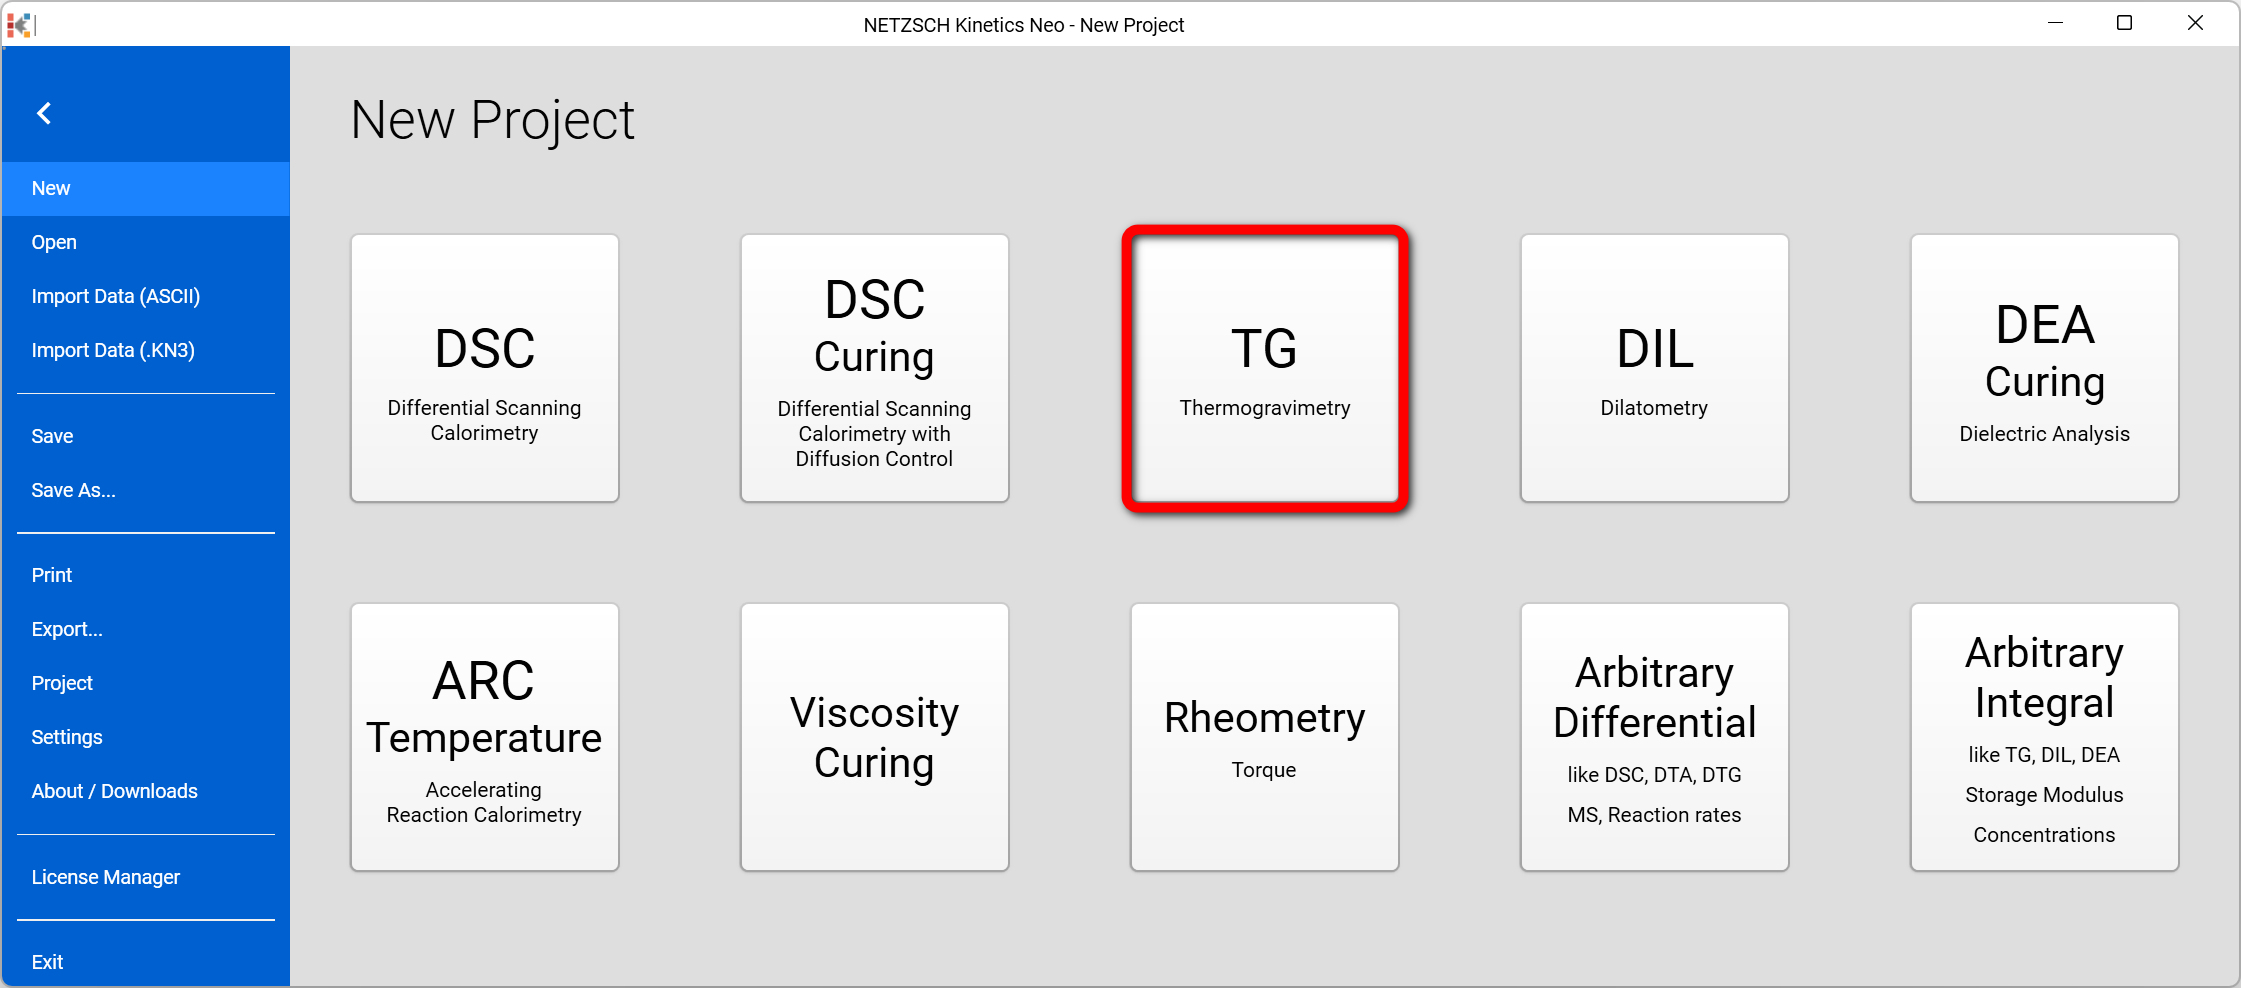
New projects are created by selecting the data type (TG in this example):
Import ASCII Source Data
The first step of a new project is the import of ASCII file which contains the measurement data. Details can be read on our main web site:
https://kinetics.netzsch.com/en/learn/import-of-user-defined-data
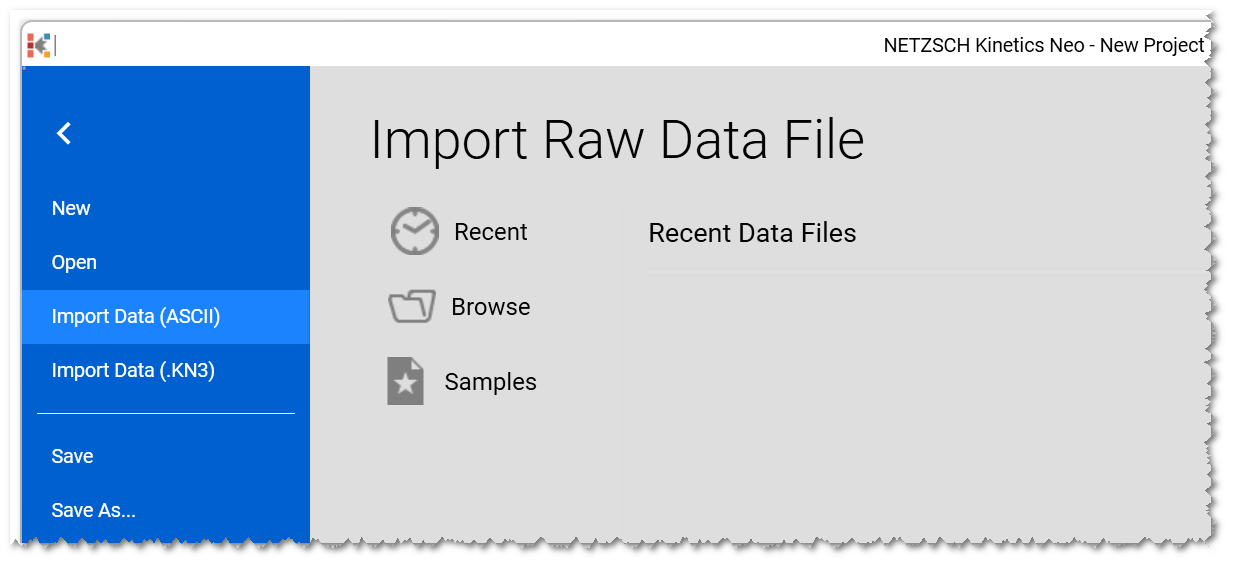
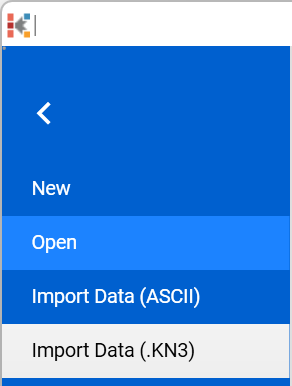
You can load measurement data into Kinetics Neo by several ways. This can be done either from a list of recent data files, via selecting the file in the file system (Browse) or from Kinetics Neo Samples folder, which is a collection of demo data and projects.
Click on Import Data (ASCII):
Then select Samples" of load file 001-3-06-07.txt from C:\Users\Public\Documents\NETZSCH\Kinetics Neo\Samples\TGA_LaOH3 folder.
Then a preview of the data is shown (if it was activated under Settings. Always show Data Import dialog in the main view):
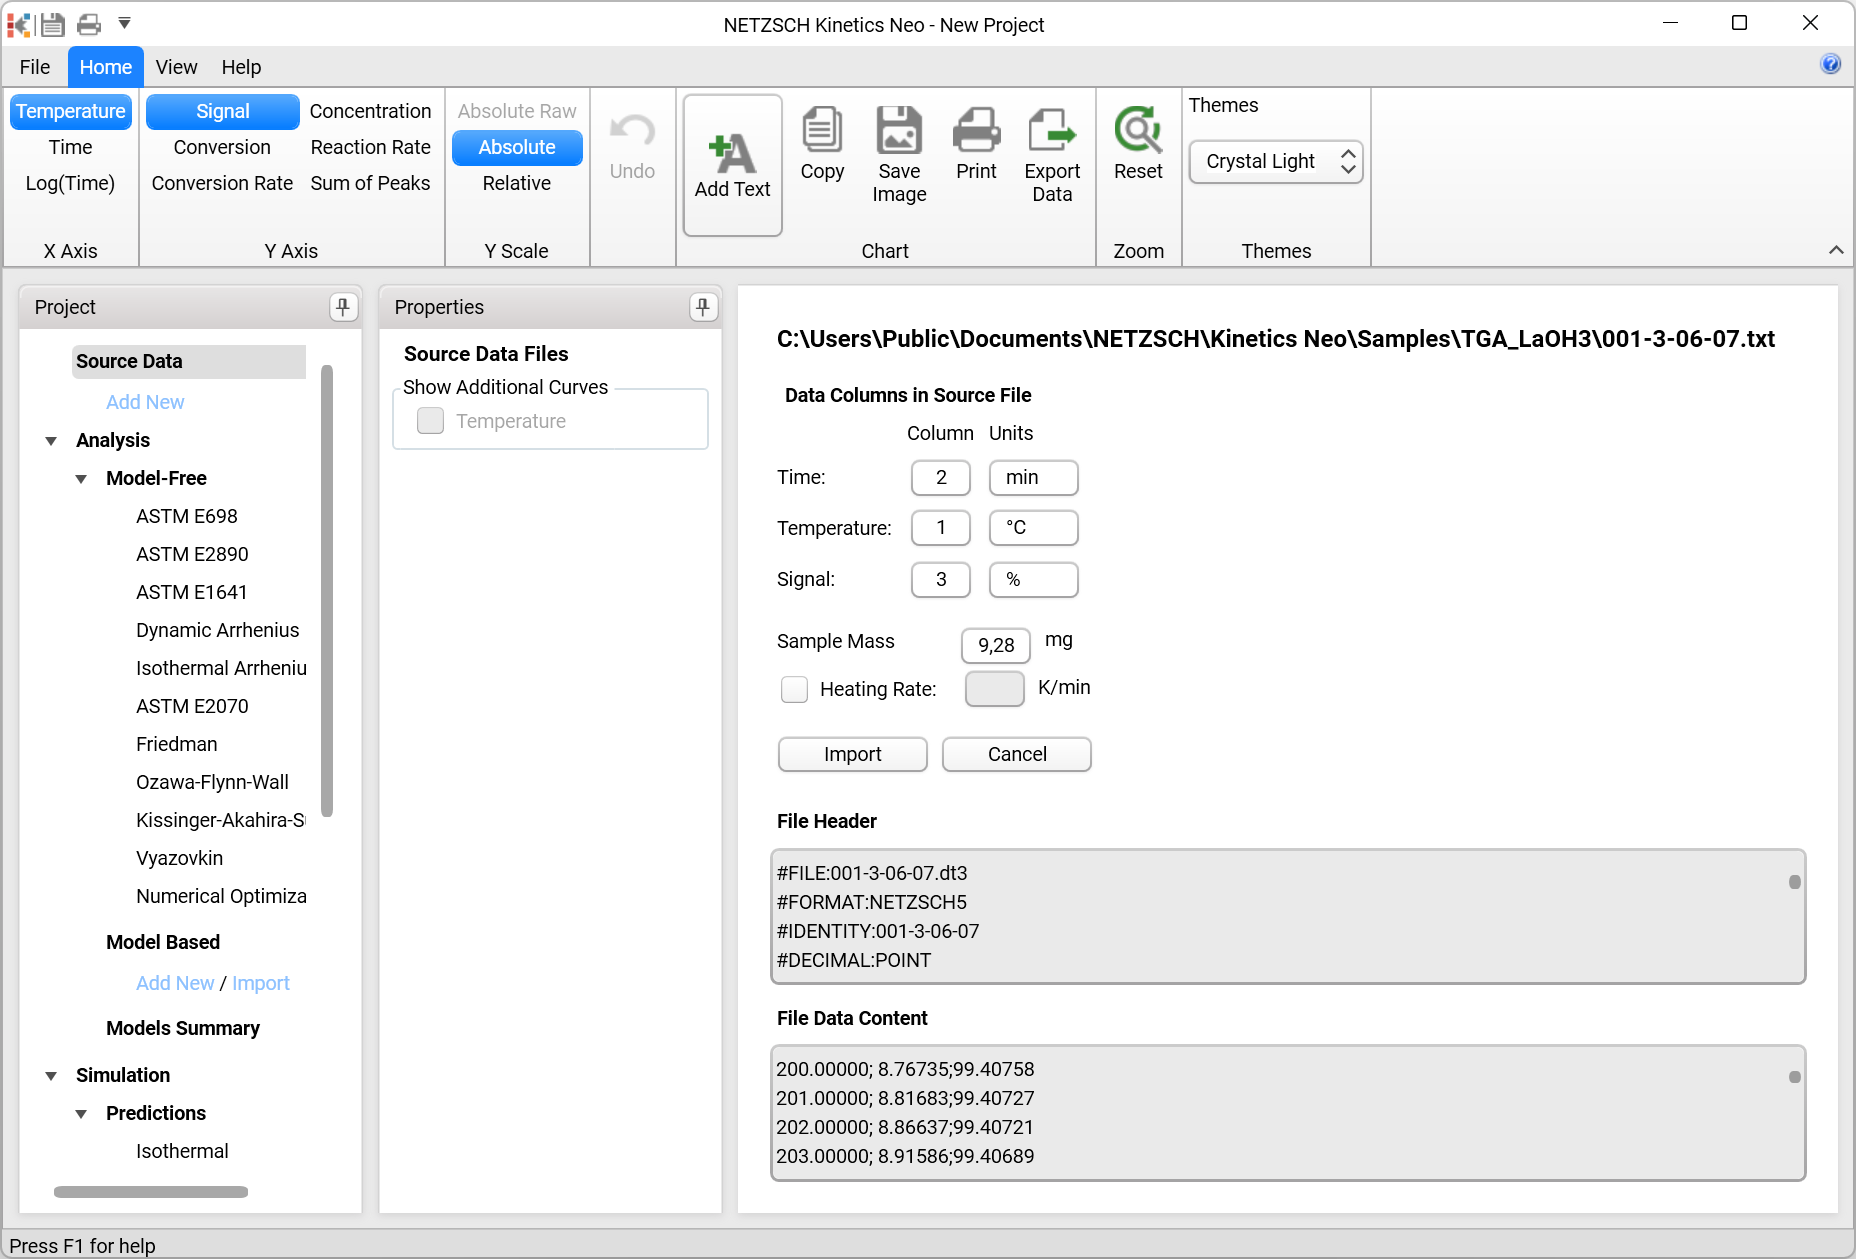
In the case of NETZSCH data, the columns, units, separator, etc., are recognized automatically. The heating rate will also be recognized if a time column exists. As it is mentioned in chapter Data Types, in case of ARC Temperature data, the signal column must be the sample temperature, too. For import of non-NETZSCH data, please see chapter Import of non-NETZSCH data.
The checkbox Heating rate is used for the time calculation if the data file contains no time column.
Press the Import button.
Important: for Kinetic Analysis and Simulation, at least three measurements (tests) with different temperature programs are required, more measurements are recommended. Different temperature programs can for example mean different heating rates or different isothermal temperatures. It is furthermore recommended that the temperature programs of the experimental data cover the range of heating rates and the temperature range that should be used for Simulation.
Data Preparation
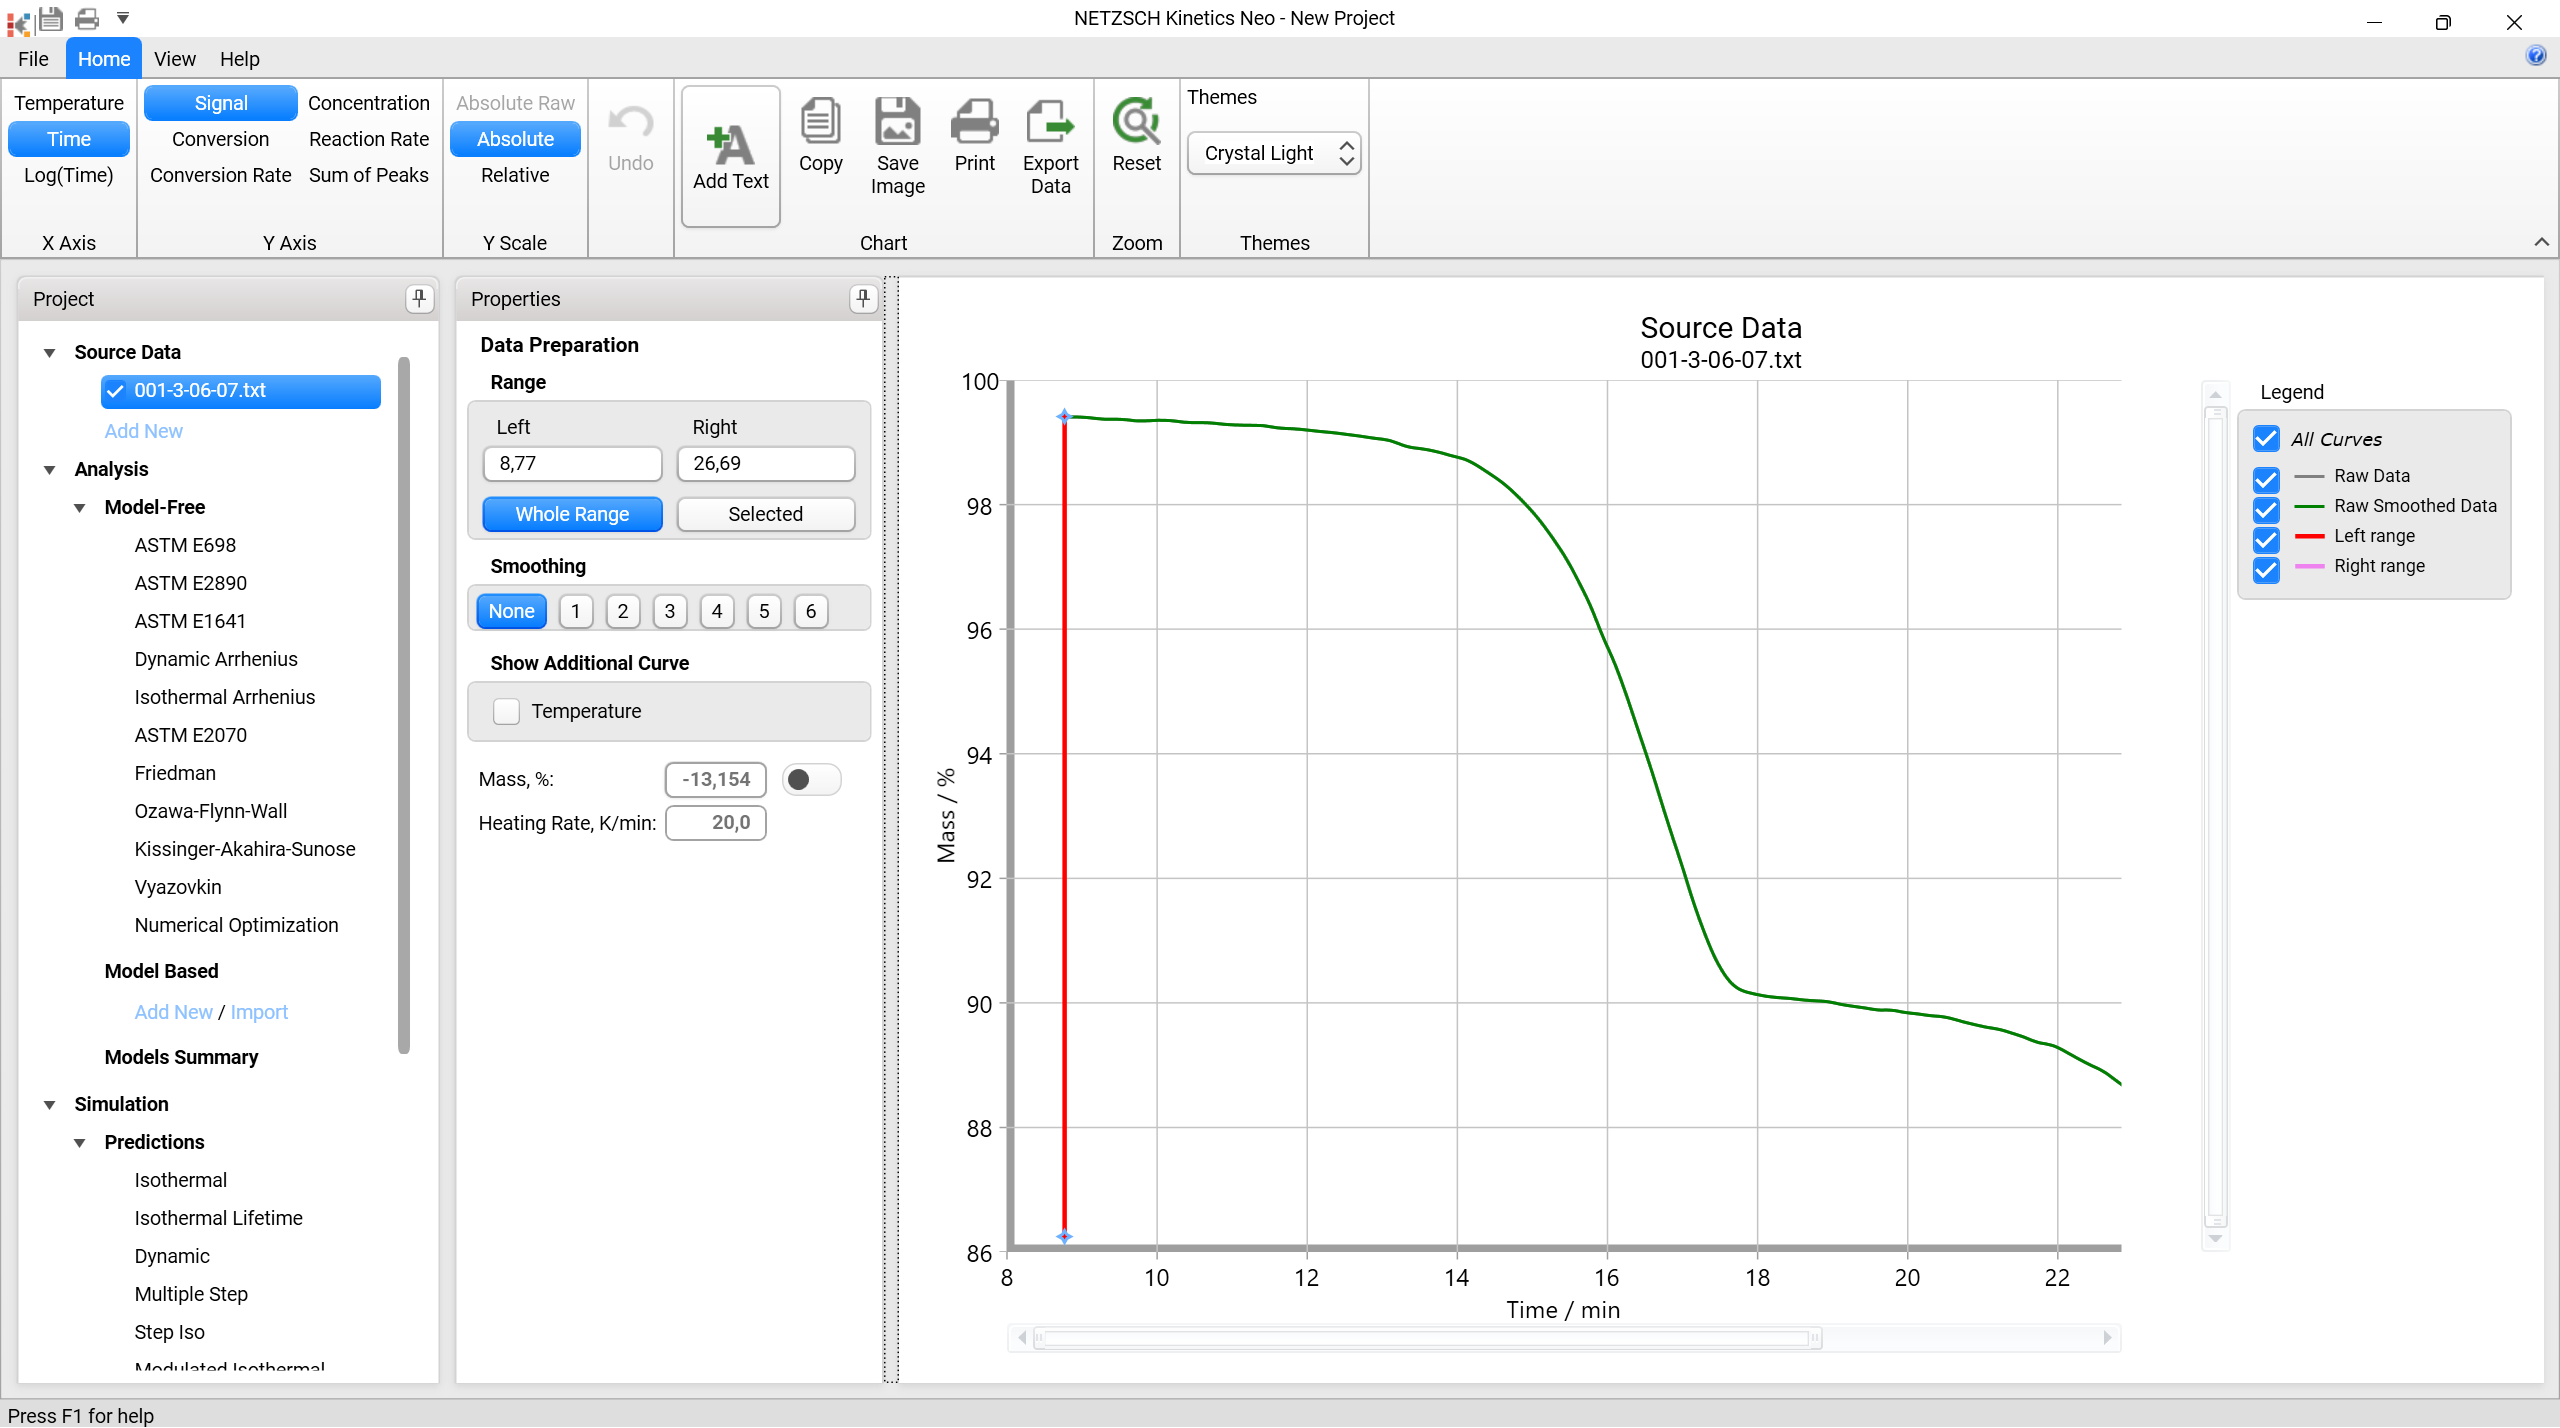
One can select a part of the curve via the Left and Right vertical range cursors. Only the selected part will be considered for kinetic analysis, but it is always possible to go back to Data Preparation (click on the file name below Source Data) and change the range again. A part of the curve selected should at least contain 50 data points during a chemical reaction.
For long curves with short effects, the Selected function can be helpful. It shows data in a selected range only, in order to have a better view during smoothing or baseline construction for DSC data.
The data can furthermore be smoothened at levels 1…6; None means no smoothing.
The Additional Curve, Temperature, can only be activated if the X-axis is set to time.
The value below smoothing line is the total reaction effect: mass loss for TGA, length change for DIL, change of ion viscosity for DEA, area for DSC or change of viscosity or torque for Viscosity or Rheometry. It is calculated automatically for the selected range, smoothing degree and Baseline for DIL data, Baseline for DEA data, Baseline for ARC Temperature data, Baseline for DSC data or Baseline for Visc. and Rheo. data.
Press OK and the import of this data file is completed.
In most cases, several data files, e.g., measurements at different heating rates will be analyzed. The import of further data is done via Add New in Source Data tree.
An alternative way of importing further data is drag&drop of data files from, e.g., the file explorer directly into the Kinetics Neo window.
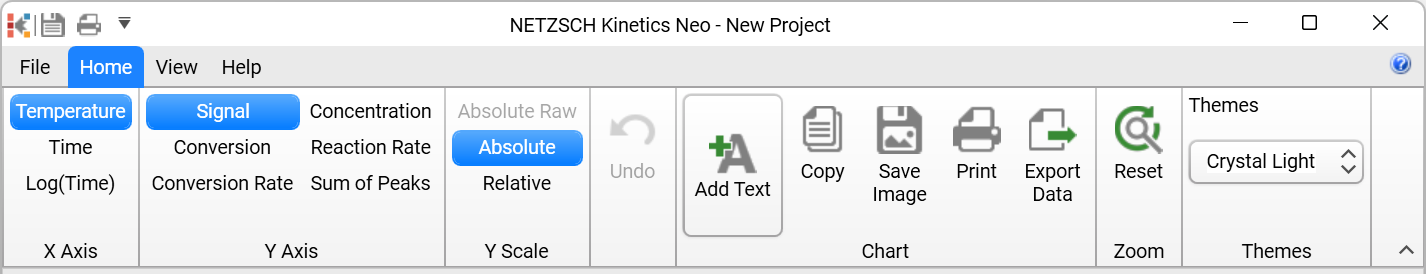
Ribbon Toolbar
Customization of the actual chart can be done by using main Ribbon Toolbar :
-
X Axis: switch between Temperature, Time or Log(Time)on X-axis.
-
Y Axis: switch between Signal, the Conversion or the Conversion Rate, the Concentration, the Reaction Rate and the Sum of Peaks on Y axis.
-
Y Scale: selectAbsolute Raw (when enabled), Absolute or Relative unit of the Y-scale.
-
Undo the last actions for each model in model based analysis.
-
Add Text for inserting a floating text field into the chart. It can be placed and edited via the left mouse button and deleted via the right mouse button.
-
Copychart image to clipboard as bitmap.
-
Save Image of the chart as PNG file.
-
Print chart in the same way as currently shown (WYSIWYG).
-
Export Data of all visible curves to an ASCII TXT file.
-
Reset Zoom to rescale chart to full scale.
-
Themes: select visual theme for the application.
Ribbon groups Chart and Zoom are active for all chart types, groups X Axis and Y Axis are active for charts having corresponding X and Y data.
The tabs View and Help are described in topic Ribbon Toolbar.
Kinetics Analysis
Kinetic Analysis (Model-Free, Model-Based, Predictions and Optimization) can be carried out as explained in further chapters.
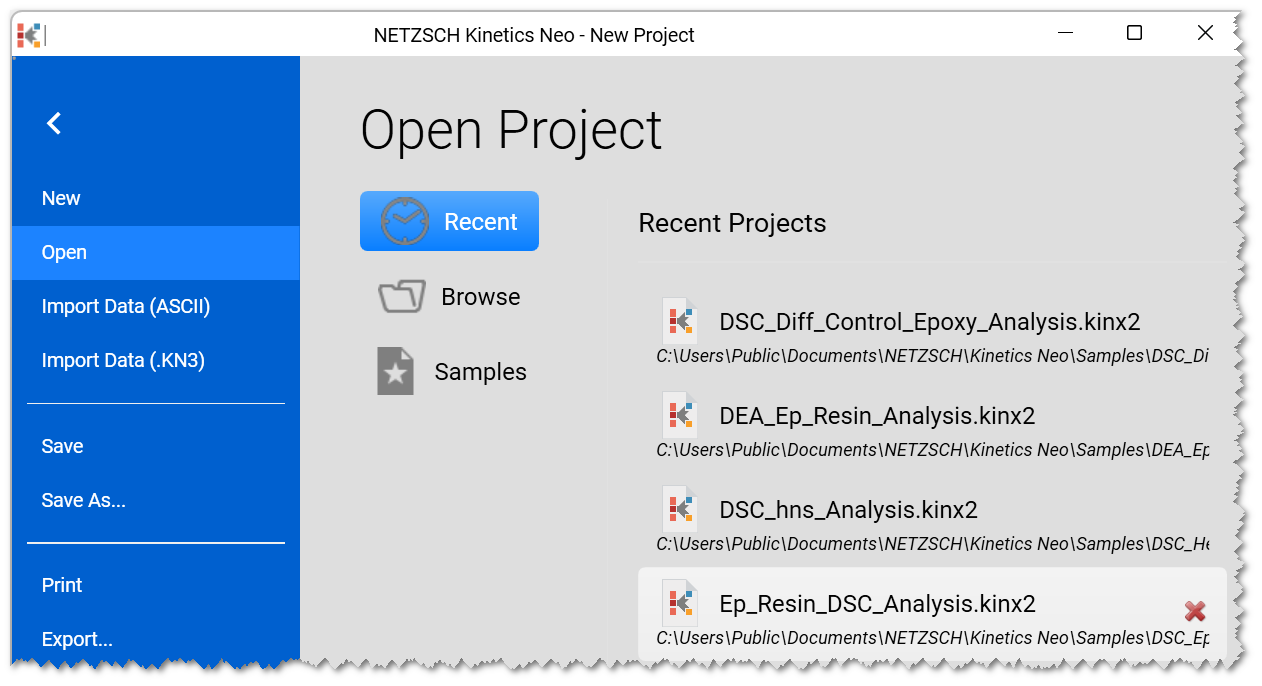
Opening and Saving Projects
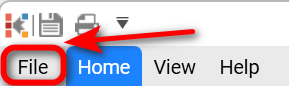
For saving or opening a project, click on File tab:
Choose Save As or Save (if it was already saved earlier):
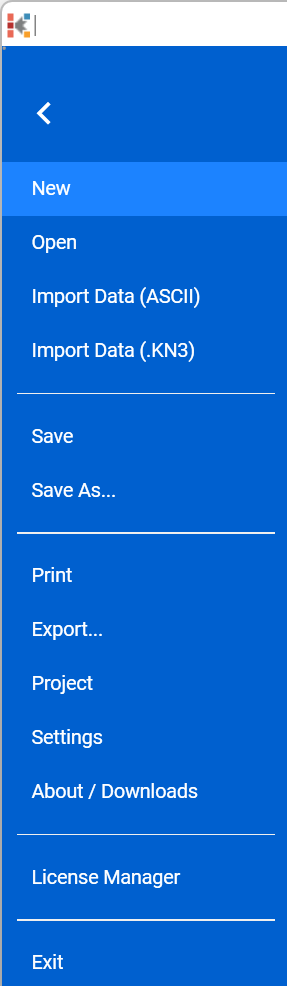
Open allows for opening existing kinetic projects:
Import Data (.KN3) is for importing data from a .KN3 (Thermokinetics version 3) project. The actual project will be closed before.
Press the back arrow
![]()
in order to go back to the Home tab.