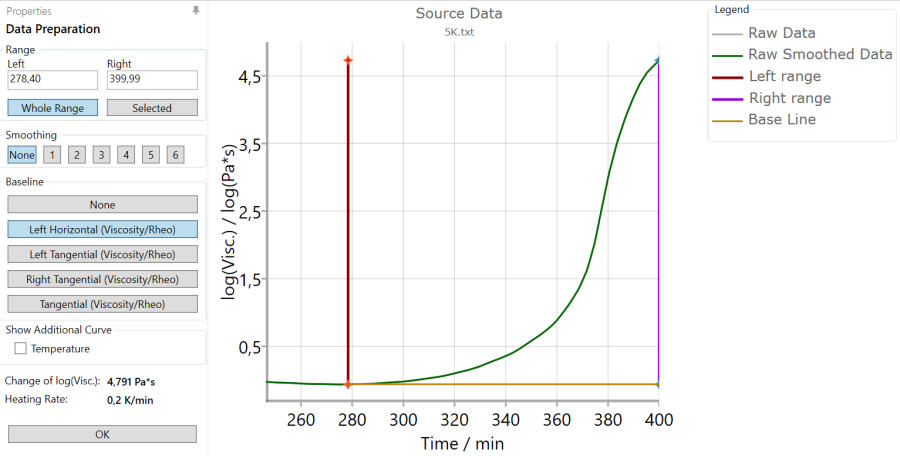
Baseline for Viscosity and Rheometry Data
In the case of Viscosity and Rheometry data, Prepare Data includes also the possibility to define an interpolated baseline that is subtracted from the data. There are several possibilities:
Baseline: None
None means that no baseline is applied.
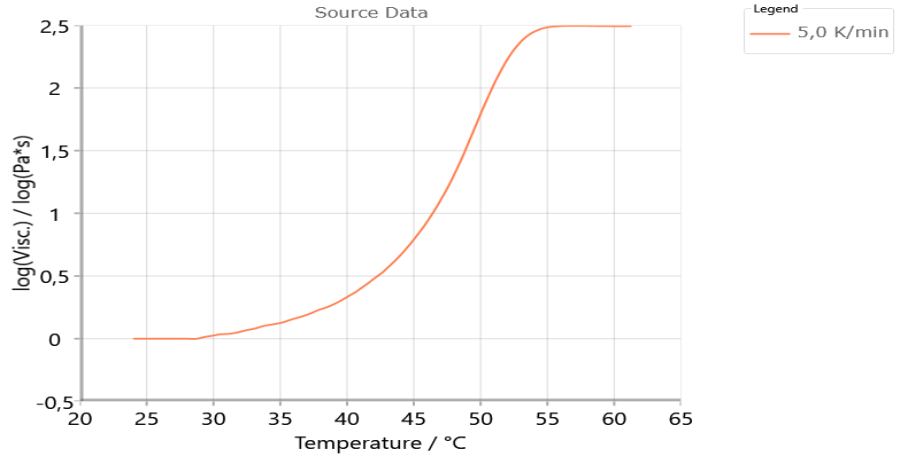
Baseline: Left Horizontal (Viscosity / Rheo)
A horizontal baseline is used where the constant value of the baseline is the data point at the left cursor:
After pressing OK, the corrected curve can be seen:
Left Tangential (Viscosity / Rheo)
This temperature-dependent baseline is calculated according to η ~ exp(Ea/RT) assuming thermal activation of the viscosity η. The parameters (offset, activation energy Ea for the temperature dependence of η) are determined at the left cursor. It is used for the temperature profiles with initial heating.
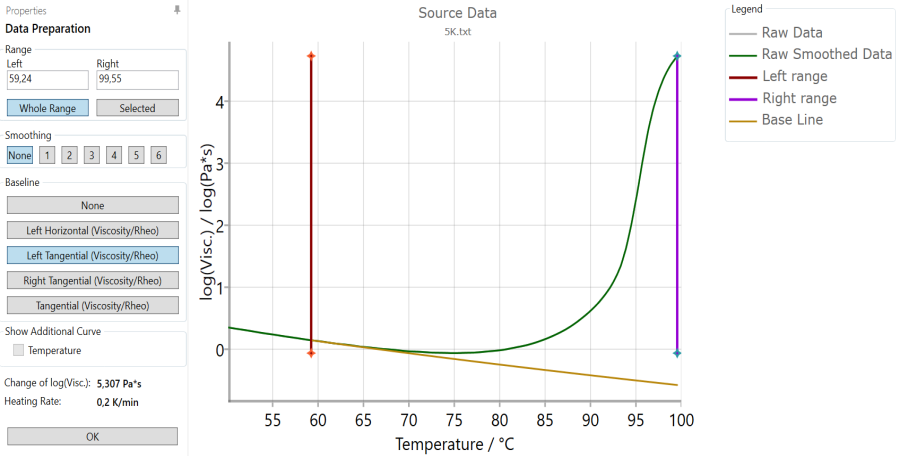
After pressing OK, the corrected curve can be seen:
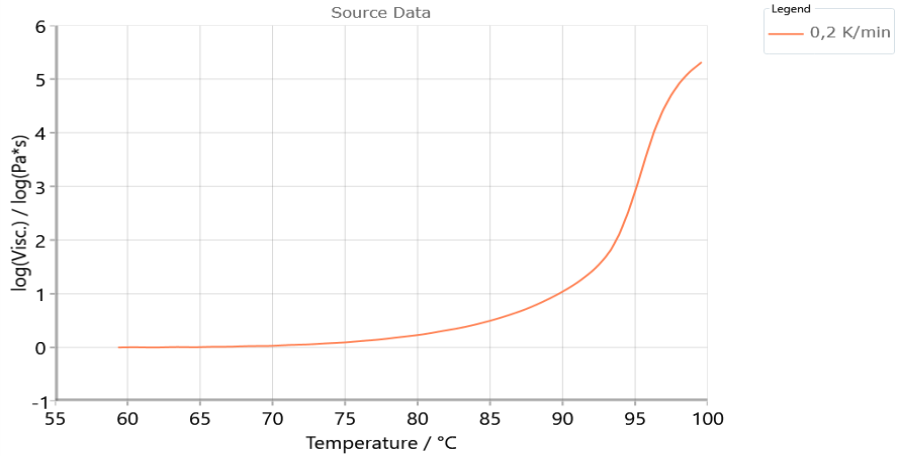
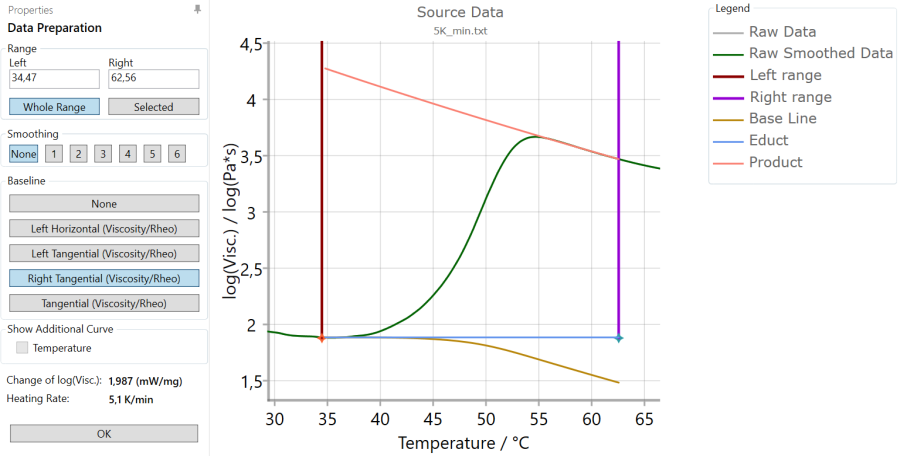
Right Tangential (Viscosity/Rheo)
This temperature-dependent baseline is also calculated according to η ~ exp(Ea/RT) assuming thermal activation of the viscosity η. The parameters (offset, activation energy Ea for the temperature dependence of η) are determined at the right cursor for the product. However, the parameters of η of the baseline vary continuously so that the baseline always starts horizontally at the left cursor.
After pressing OK, the corrected curve can be seen:
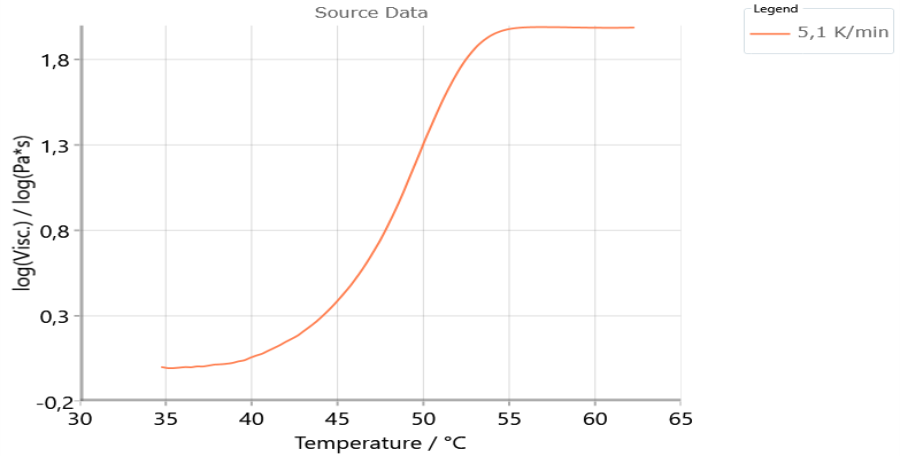
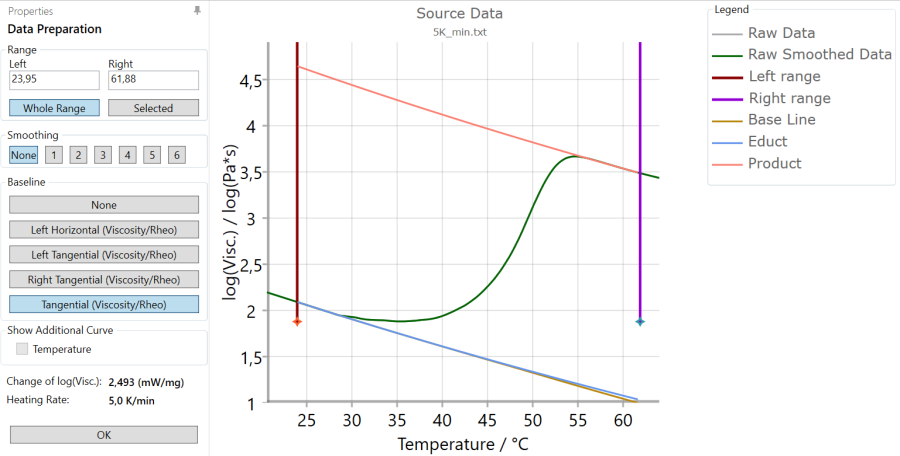
Tangential (Viscosity/Rheo)
This baseline is also for an entirely dynamic temperature program. This temperature-dependent baseline is also calculated according to η ~ exp(Ea/RT) assuming thermal activation of the viscosity η. However, the parameters (offset, activation energy Ea for the temperature dependence of η) are determined at the left cursor for the educt and at the right cursor for the product. The parameters of η of the baseline vary continuously between the educt’s and the product’s parameters where the interpolation is calculated utilizing the deviation of the data from educt behavior to product behavior as a weight function.
After pressing OK, the corrected curve can be seen: