Settings
Load last used project by application start
Always show Data Import dialog for recognized NETZSCH data files
Show Correction of DSC data regarding Time Constant
Show Durbin-Watson Statistics in Models Summary
Show two Additional Arrows for Adjusting Step ...
Digital precision of exported data
Auto-Detection of Time Units on Chart
Show Markers in Source Data Chart for Series with only Few Data Points
Geographic Maps: Online / Offline
Settings panel can be found if you click on File in the top main Ribbon and select Settings in the left panel:
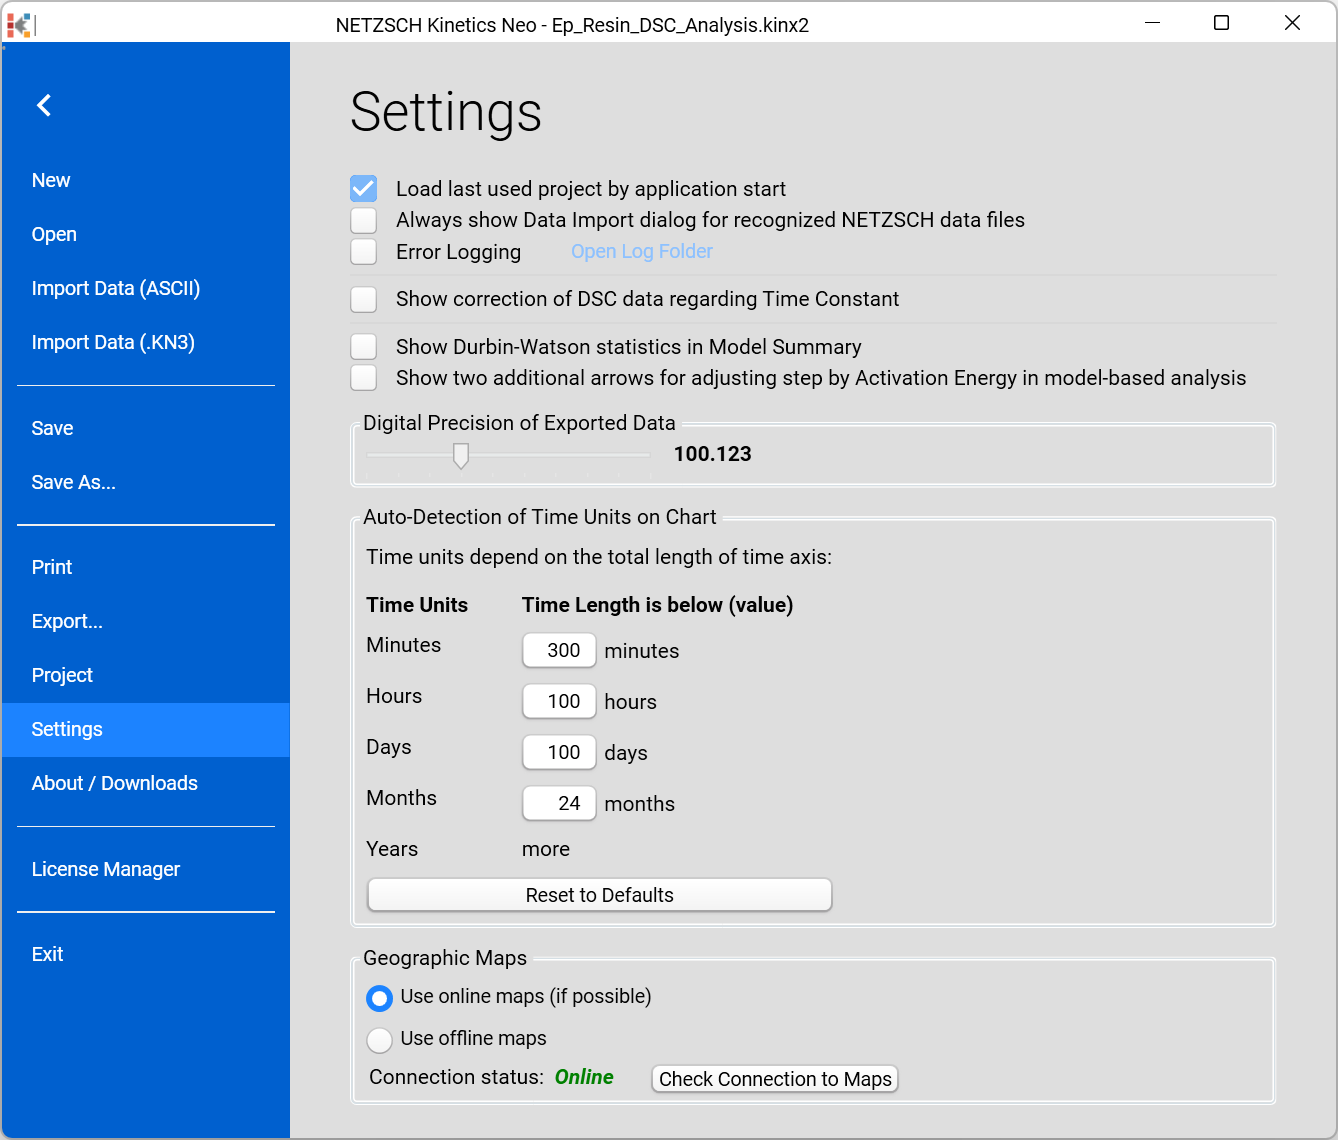
Load last used project by application start:
If activated, the last used project will automatically be loaded when the Kinetics Neo software is started.
Always show Data Import dialog for recognized NETZSCH data files:
The Data Import dialog is required for Import of non-NETZSCH data, because you have to select data columns which contains time, temperature and a signal. For NETZSCH data files it is usually correctly selected automatically, and in this case this dialog is just for information.
Data Import window a preview of the data and the definition of the columns, units, separator, etc.
Error Logging:
If Error Logging is activated, error messages and other useful information (for software developers) are logged in a txt-file. This file can be found via Open Log Folder.
Show Correction of DSC Data regarding Time Constant:
If the checkbox is activated, then DSC Correction regarding Time Constant (DSC Deconvolution) is available in Data Preparation of DSC Data.
Show Durbin-Watson Statistics in Models Summary:
If the checkbox is activated, the Durbin-Watson Value and Durbin-Watson Factor are shown in Models Summary.
Show two Additional Arrows for Adjusting Step by Activation Energy in Model-Based Analysis:
If the checkbox is activated, two additional arrows for adjusting a step by activation energy are shown in Model-Based Analysis.
Digital precision of exported data:
One can set the digital precision of exported data, e.g. predicted curves, using the slider. The number of digits after decimal point can be set between zero and nine as it is visible from the example.
Auto-Detection of Time Units on Chart:
The units for time axis are selected automatically dependent on the total axis length (minutes, days, or years). One can set between which values of the total axis length which time unit is used. For example, in case of the Default values (see screenshot above), the unit hours is used in the interval between 300 minutes (= 5 hours) and 100 hours.
Show Markers in Source Data Chart for Series with only Few Data Points
If activated, the data with few points (sparse data) can be shown in Source Data chart as the markers only or as markers with connecting lines.
When source data series contains only few points (for example, 10 points instead of 500 or more), then each data point is important and should be shown on the chart. You can set the threshold amount of data points since which the Kinetics Neo will show marker for each data point of the chart. Default value is 20. You can set it to any value you need, like 50 as shown on the screenshot above.
When amount of points in source data exceeds this threshold, then data will be shown as solid line, without markers.
See more in Persistent Visibility of Series.
Geographic Maps: Online / Offline
In Climatic Predictions, online Microsoft Bing maps are shown if Use Online Maps is selected and the website https://www.bing.com/maps is accessible (Maps Service Connection Status: Online).
Offline maps are shown if Use Offline Maps is selected or the Maps Service Connection Status is Offline.