Predictions: Climatic
Predictions of the reaction progress based on a real climate temperature profile (also called Climatic Predictions). The real temperature profile can be selected for about 100 different points on Earth for a selected period of time in the past; predictions have a selected starting date and duration of the forecast which is usually several months or years. In general, such predictions are important for long-time storage where, for example, degradation processes of packaging and coating, curing of paints or epoxy, or safe storage of high energetic materials are of interest.
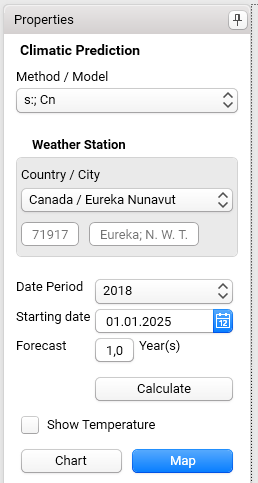
First, a Method/Model (model-free or model-based) needs to be selected, where only those models are offered with which the data were already analyzed.
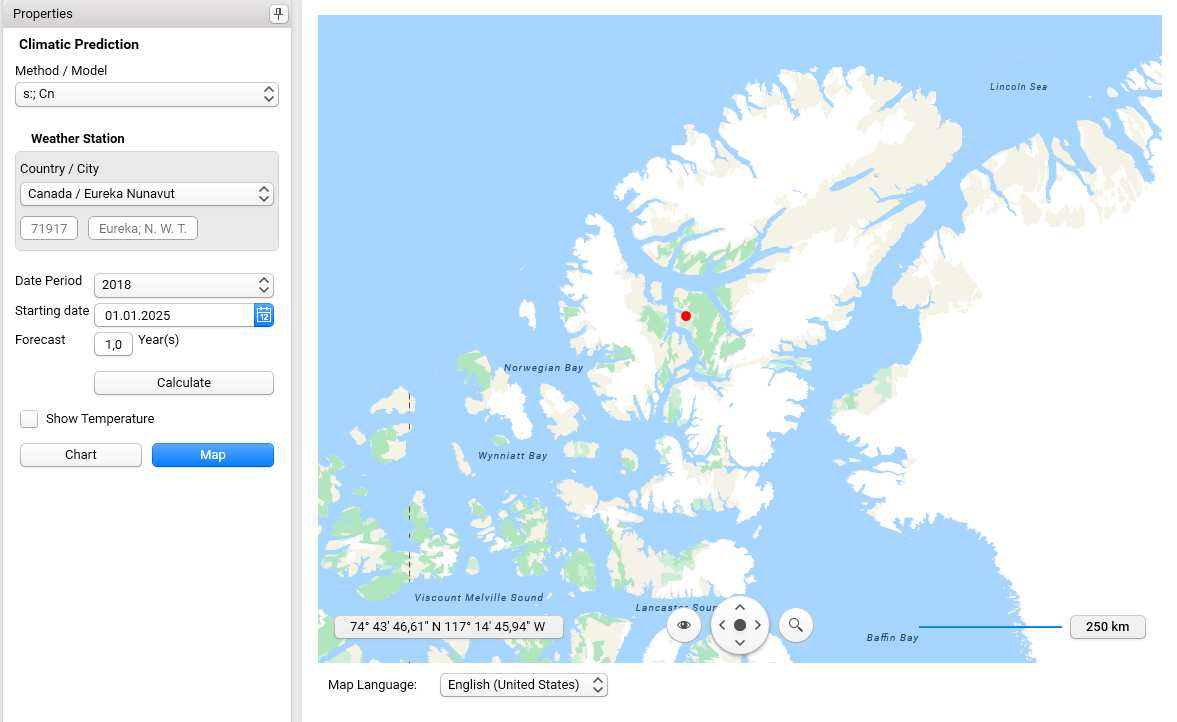
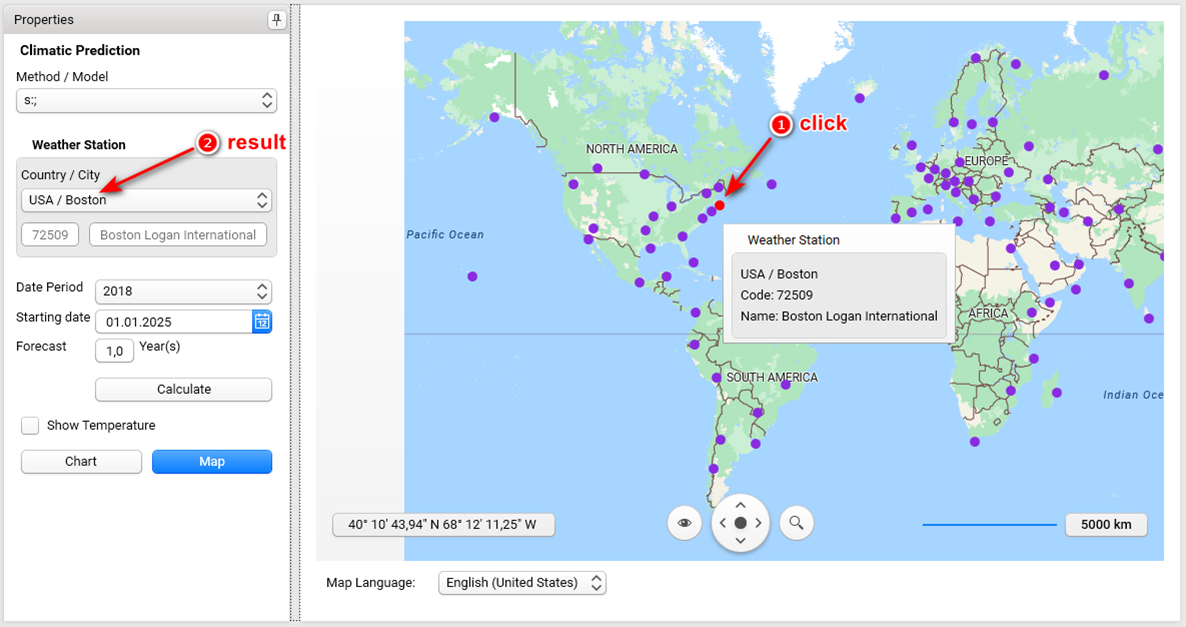
Select a Weather Station of a certain Country/City in the world. More than 100 different weather stations are offered in a list and the selected weather station is marked in red in the Map. If the mouse pointer is above any weather station, then the station info is shown (city, code, name).
Since Kinetics Neo version 3.5 a weather station can be selecting just by clicking on it on the map:
Date Period offers the selection of the real-temperature profile in a certain period of time in the past.
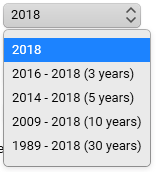
In 2018, the exact minimum and maximum temperatures for each day of 2018 are considered. In case of longer periods 2016-2018 (3 years), 2014-2018 (5 years) and 2009-2018 (10 years), the minimum and maximum average daytime temperatures are considered.
Starting Date defines the starting date of the predictions. Click on the little calendar icon and select the desired starting date.
Forecast defines the duration of the predictions in unit years. Enter the desired value.
Press
![]()
In order to calculate the predictions.
Exemplary simulation results (visible after pressing the Chart button, Show Temperature checkbox was activated and Auto Zoom for two y-axis was used):
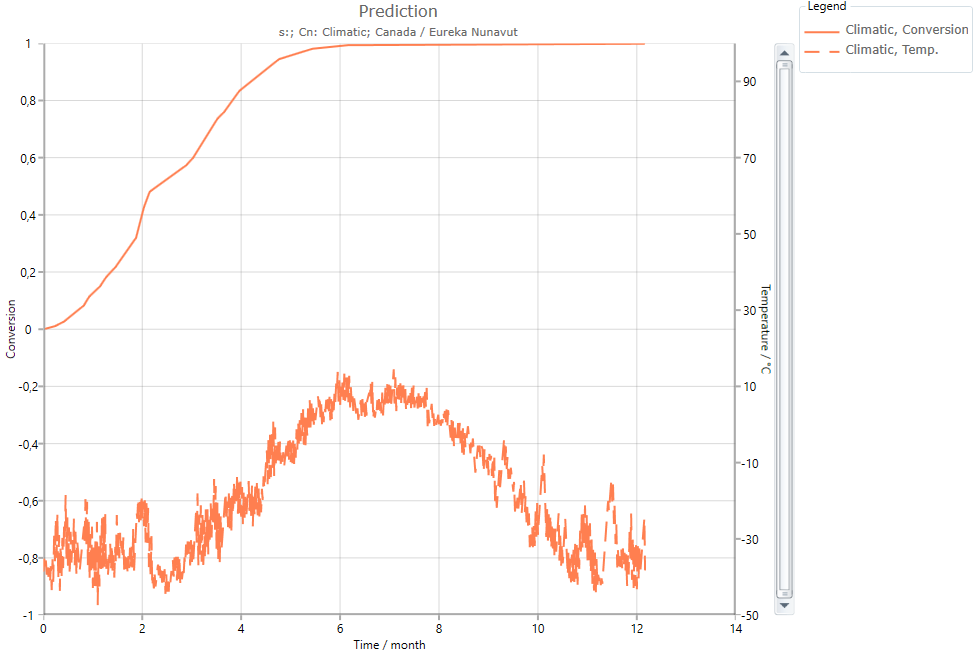
In this example, the temperature changed from -47°C in February to 14°C in August. The upper curve is the prediction of the curing process for these temperature conditions. The reaction starts slowly in January and finished at the end of June.
Customization and exporting of the results can be done via Ribbon Toolbar.
It should be noted that the Map offers zooming functionality (use the mouse wheel or the tool at the right bottom):