Ribbon Group "Y Axis": Detailed Description
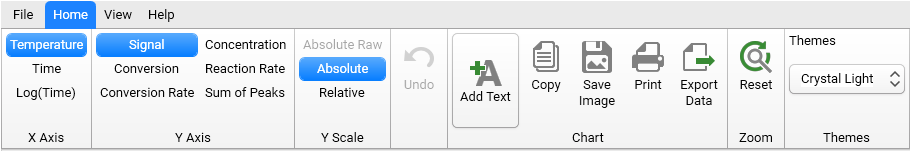
The first, left column of group "Y Axis" contains following items
-
Signal - shows measured or simulated signals like DSC, TG, DIL etc.
-
Conversion - shows calculated from experiment or simulated conversion values from 0 to 1.
-
Conversion Rate - shows the first derivative from the Conversion curve in %/min.
These graphical presentations can be used in the following modes (see tree view in the project panel on the left):
Source Data
Measured experimental data.
Model-Free Analysis - Conversion Fit:
Experimental data and the fit calculated by means of one of model free methods.
Model-Based Analysis
Experimental data
and the fit calculated by means of the kinetic model containing one or several reaction steps.
Predictions
Simulation calculated for given
temperature conditions by means of model free or model based methods.
Optimization
Calculated temperature profile
and corresponding signal for the given reaction rate profile.
All graphics in these presentations can be show either in Absolute or in Relative scaling.
The second, right column of group "Y Axis" contains:
Concentration - shows the simulated individual relative concentration for each reactant in the kinetic model created by model based analysis. Relative concentrations have values from 0 to 1.
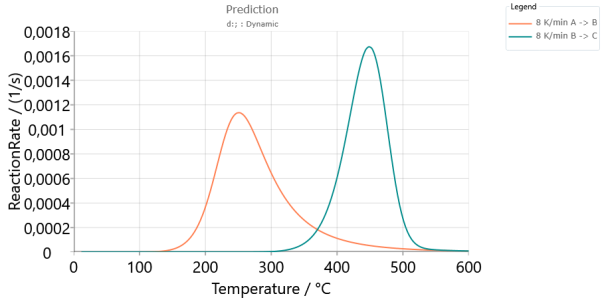
Reaction Rate - shows the simulated individual reaction rate for each reaction step in the kinetic model created by model based analysis. The absolute reaction rate has the unit [1/s]. The relative reaction rate has unit [%/min] and means conversion rate for the corresponding reaction step.
-Sum of Peaks - shows the simulated individual peak curve for each reaction step in the kinetic model and the sum of these peaks as the simulated conversion rate. It shows each reaction step as the part of the total signal.
Advantages
-
Each step in model-based analysis is shown separately
-
The sum of all peaks is presented.
Usage:
- For model-based analysis only.
View:
- Analysis – model-based.
- Predictions for model-based-method
- Optimization for model-based method.
Note: Sum of Peaks is NOT equal to Peak Separation software.
Sum of Peaks:
-
Works with several curves
-
Peak shape has chemical Arrhenius background
-
Individual reactions can be dependent according to kinetic model
-
Used for chemical reactions only.
Peak Separation:
-
works with a single curve
-
Peak shape is mathematical function like Gaussian
-
All peaks are independent
-
Uses for both chemical reactions and melting of polymers.
These graphical presentations can be used in the following modes (see tree view in the project panel on the left):
Model-Based Analysis
Set of individual curves for reactants or reaction steps, calculated during the kinetic analysis by means of the kinetic model
containing one or several reaction steps.
Simulation(Predictions and Optimization for model-based methods only)
Set of individual curves for reactants or reaction steps, calculated during predictions or optimizations by means of the kinetic
model containing one or several reaction steps.
All graphics in these presentations can be show only in Absolute scaling
Examples of graphical presentations
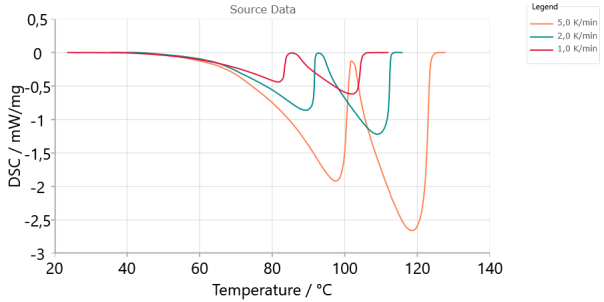
Source Data, Signal, Absolute scaling:
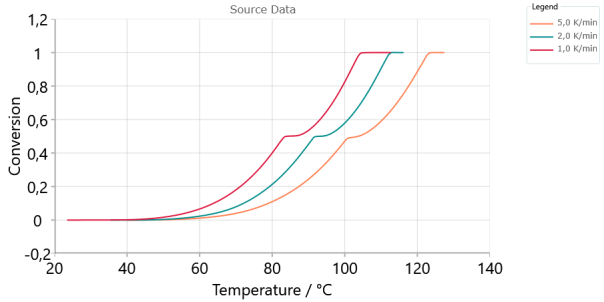
Source Data, Conversion, Absolute scaling:
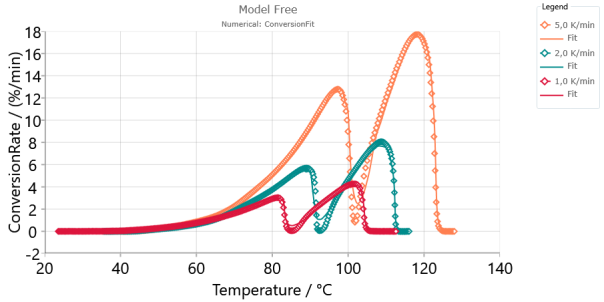
Model-Free Analysis, Conversion Rate, Absolute scaling:
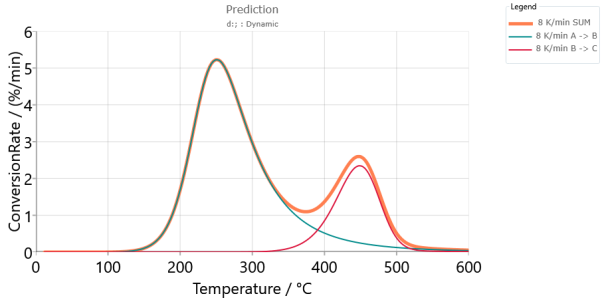
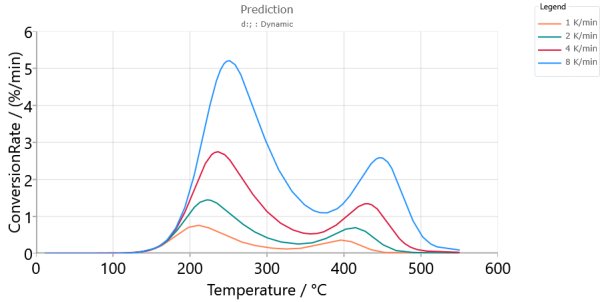
Predictions for model-based method, Conversion Rate, Absolute scaling:
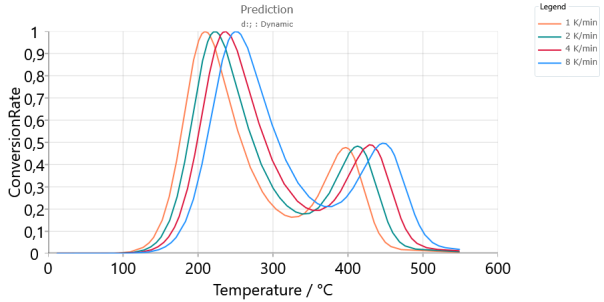
Predictions for model-based method, Conversion Rate, Relative scaling:
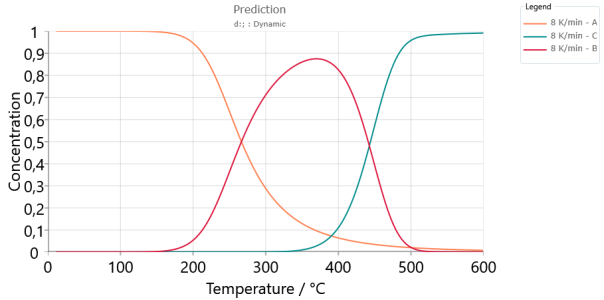
Predictions for model-based method, Concentration of each reactant for double-step kinetic model:
Predictions for model-based method, Reaction Rate for each individual reaction for double-step kinetic model:
Predictions for model-based method, the peaks for each individual reaction make the contributions to the Sum of Peaks. The sum of all peaks is the Conversion Rate for the total reaction by the double-step kinetic model: