Ribbon Toolbar: View Tab
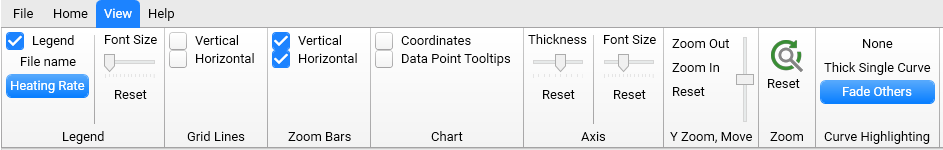
Legend
Show / hide the Legend. One can select if in the legend the File name for each curve is shown or the Heating Rate. For isothermal data, the isothermal temperature is shown, respectively.
Adjust the Font Size of the legend using the slider.
Grid Lines
Show / hide vertical, horizontal Grid Lines.
Zoom Bars
Show / hide vertical and horizontal Zoom Bars. They appear on the right side and below the chart.
Zooming can be done directly in the chart via the left mouse button or via the Zoom Bars, or alternatively via clicking Zoom In or Zoom Out.
Chart
Show / hide Chart Coordinates. The position of the mouse cursor in the chart is shown as X and Y coordinates. The coordinates box can be moved over the chart.
Show / hide Data Point Tooltips of the X and Y coordinates that are shown in a tooltip when the mouse cursor is over a data point.
Axis
Axis Thickness and Font Size can be changed using the sliders.
Reset to restore the default values.
Y Zoom, Move
Move shifts the curves in Y direction.
Zoom
Auto Zoom to turn on the rescale mode for all charts with two axes to full scale for two graphics placed one above another. This option appears on toolbar only for X-time with activated temperature curves. If this option is ON then no manual resize is possible. Switch it OFF in order to have manual resize functions again.
Reset Zoom to rescale chart to full scale.
Curve Highlighting
Curve Highlighting to highlight the curves directly on the chart area.
Ribbon Access tool groups Grid Lines, Legend, Zoom Bars, Zoom are active for all chart types.