Curve Highlighting
Since version 2.1.2 it is possible to highlight the selected curve on the chart by on the curve symbols on the legend. The curve symbol in the legend and also on the chart are shown thicker as the other curves.
Since version 2.5.5 it is possible to highlight the curves by only holding the mouse pointer over the curve (hover).
In Ribbon tab View you will find several highlighting modes to select:
-
Thick Single Curve (default)
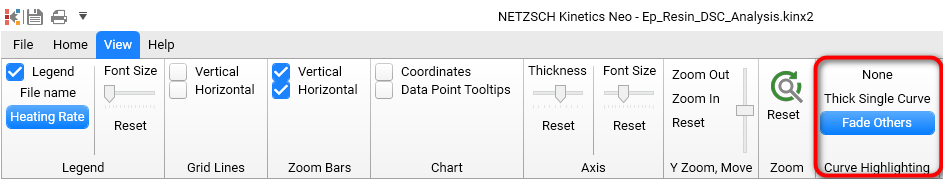
None
The mouse cursor doesn't affect the curves highlighting when it moves over the curves. This behavior was standard for all previous Kinetics Neo versions.
Thick Single Curve
When the mouse cursor hovers over the curve on the main chart, the curve under the cursor painted thicker as the others. This effect is visible on the main chart and also in the legend.
Fade Others
Here when the mouse cursor hovers over the curve on the chart, the curve under the cursor painted thickness as others and the other curves are faded (painted less visible). This is somehow similar to previous effect "Thick Single Curve". The difference is in the fading of the other curves. Now the curve under the cursor is much better to see.