Ribbon Toolbal: Home Tab
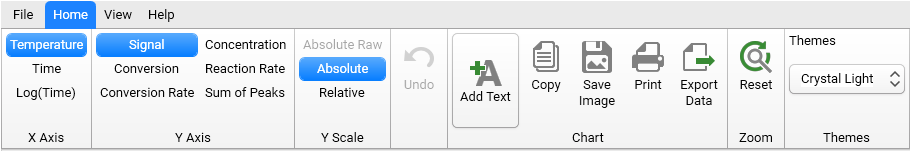
X-Axis
Switch between Temperature, Time or Log(Time) for x-axis.
Y Axis
Switch y axis to show the Signal, the Conversion or the Conversion Rate, the Concentration, the Reaction Rate and the Sum of Peaks.
See Ribbon Group "Y Axis": Detailed Description for more information.
Y Scale
Choose Absolute or Relative unit of the scale for y axis.
See Ribbon Group "Y Scale": Detailed Description for more information.
Undo
Undo the last actions for each model in model based analysis.
Chart
Add Text for inserting a floating text field into the chart. It can be placed and edited via the left mouse button and deleted via the right mouse button.
Copy chart image to clipboard as bitmap.
Save Image of the chart as file in PNG format.
- Print chart in the same way as currently shown.
-Export Data of all visible curves to an ASCII txt-file.
Zoom
Auto Zoom to turn on the rescale mode for all charts with two axes to full scale for two graphics placed one above another. This option appears on toolbar only for X-time with activated temperature curves. If this option is ON then no manual resize is possible. Switch it OFF in order to have manual resize functions again.
Reset Zoom to rescale chart to full scale.
Ribbon Access tool groups Chart and Zoom are active for all chart types, tool groups XAxis and YAxis are active for charts having corresponding X and Y data.