Model-Free: Ozawa-Flynn-Wall Analysis
The Ozawa-Flynn-Wall analysis is an integral isoconversional method, where the measurements are analyzed for multiple conversion levels. At least two dynamic measurements with positive heating rates are required.
The determination of the activation energy is using the points at the same conversion (0.01, 0.02, …, 0.99) from the measurements at different heating rates. There is no assumption about the reaction type.
Analysis
Analysis shows a graphic of Log(HeatingRate) vs. inverse temperatures of the points at the same conversion. Linear fit curves are shown for each conversion value specified:
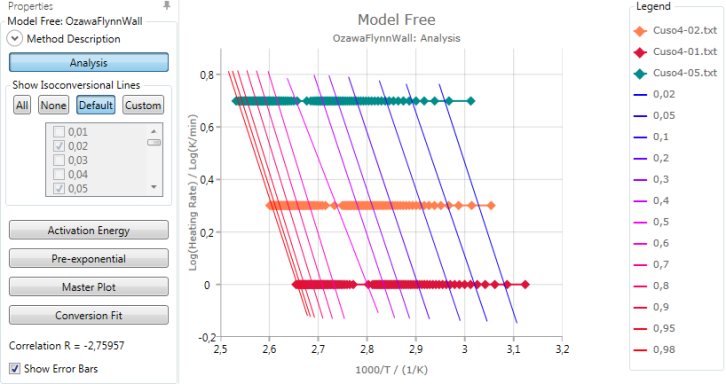
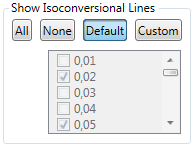
Any of these isoconversional lines can be shown selecting All, None, Default or Custom:
Activation energy and pre-exponential results are found from the slope and intersect of these linear fits.
The calculated Correlation R is explained in section Statistics.
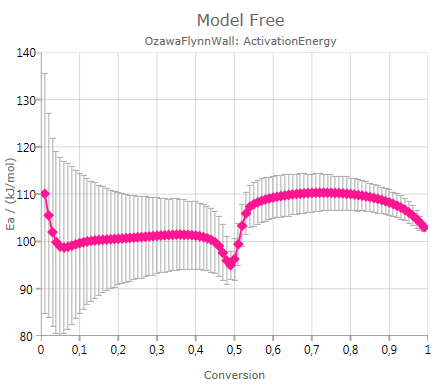
Activation Energy
Pressing
![]()
shows the calculated activation energy including error bar – if the checkbox Show Error Bars is activated:
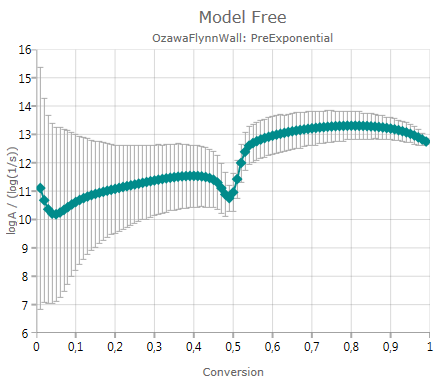
Pre-Exponential Factor
Pressing
![]()
shows the calculated pre-exponential including error bar – if the checkbox Show Error Bars is activated:
The chart presents decimal logarithm of pre-exponential factor.
Master Plot
Pressing
![]()
shows the calculated ratio f(α)/f(0.5):
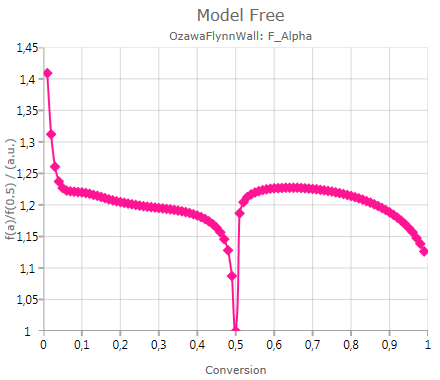
The ratio f(α)/f(0.5) is useful for the graphical estimation of the reaction type for single-step processes.
Conversion Fit
Pressing
![]()
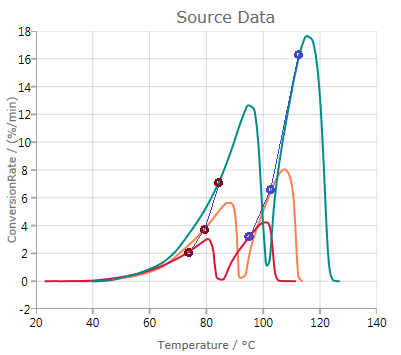
shows experimental and simulated values, where the simulation is done based on the results of the Ozawa-Flynn-Wall analysis:
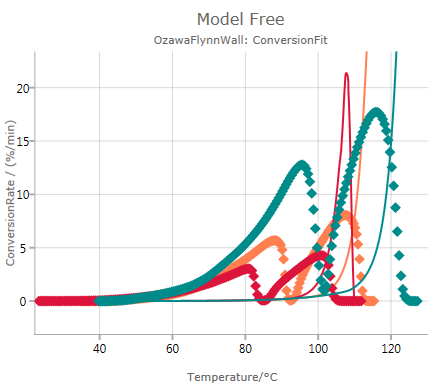
In this case, the mismatch between data and simulated values indicates that the analysis according to Ozawa-Flynn-Wall might not be reliable.
Advantages
Advantages of this method:
- for multiple-step reactions without parallel reaction steps
- each reaction point is evaluated
Disadvantages
Disadvantages of this method:
- suitable only for dynamic measurements
- for parallel and independent reactions, Ozawa-Flynn-Wall gives the mean values of Ea