Statistics
Students Coefficient 95%
Student’s t-distribution is the continuous probability distribution for estimation of mean of normally distributed population if the standard deviation is unknown. The Student’s coefficient depends on the number of degrees of freedom and could be used for the calculation standard errors of the parameters.
We calculate the Student’s coefficient with significance of 95% according to the known extrapolation, which can be found, for example in https://en.wikipedia.org/wiki/Student%27s_t-distribution:
Probability density function for Student’s distribution:
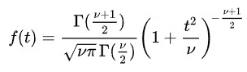
Where ν is the number of degrees of freedom and Гis the Gamma function. This may also be written as
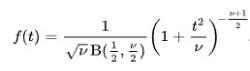
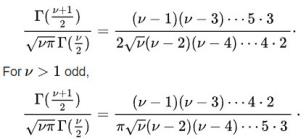
Where B is the Beta function. In Particular for integer values degree of freedom ν we have
Durbin-Watson Value
In statistics, the Durbin–Watson statistic is a test statistic used to detect the presence of autocorrelation in the residuals (prediction errors) from a regression analysis.
The well-known calculation and interpretation of this statistics can be found, for example, in
https://en.wikipedia.org/wiki/Durbin%E2%80%93Watson_statistic
If the et is the residual associated with the observation at time t, then the test statistics
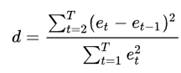
Where T is the number of observations. In the Kinetics Neo it is the sum over all points and all curves. Here et is the residuals calculating as the difference between the measured and simulated values.
The value of d always lies between 0 and 4. If the Durbin–Watson statistic is less than 2, there is evidence of positive serial correlation. As a rough rule of thumb, if Durbin–Watson is less than 1.0, there may be cause for alarm. Small values of d indicate successive error terms are positively correlated. If d > 2, successive error terms are negatively correlated. In regressions, this can imply an underestimation of the level of statistical significance.
The value of d is approximately equal to 2(1-ρ), where ρ is the sample autocorrelation of the residuals.
The Durbin-Watson value d is always in the interval [0; +4].
d = positive autocorrelation
d = no autocorrelation
d = negative autocorrelation
Important: The Durbin-Watson value strongly depends on smoothing of the data. The smoothing of data usually leads to low Durbin-Watson value, showing autocorrelation of residuals.
Durbin-Watson Factor
The Durbin-Watson Factor describes the increase of standard errors caused by autocorrelation
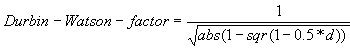
where d is the Durbin-Watson value explained above.
F-Test
https://de.wikipedia.org/wiki/F-Test
An F-test (Fisher Test) is the statistical test in which the test statistic has an F-distribution under the null hypothesis. It is most often used when comparing statistical models that have been fitted to a data set, in order to identify the model that best fits the population from which the data were sampled. Exact "F-tests" mainly arise when the models have been fitted to the data using least squares.
F-Test for two kinetic models.
Null hypothesis: both models have the same dispersion (both of them are statistically good):
![]()
Alternative hypothesis the first model has higher dispersion than the second model (the second model is significantly better than the first one):
![]()
For test of null hypothesis the F-Test is calculated:
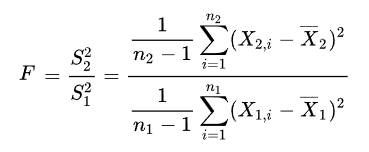
Where Si is the sample variance and Xi is the mean for residuals of model i, and ni is the degrees of freedom for this model. Sum is calculated over all points and all curves.
For the null hypothesis the F-Test has F-distribution with n2-1 degrees of freedom in the numerator and n1-1 degrees of freedom in denominator. Null hypothesis is rejected for too high values of F-test. If F-test < Fcritical then both models are statistically equivalent. If F-test > Fcritical then the second model is significantly better than the first one. Usually the significance is calculated with the value of 95%
F-Test New Step
In principle, the addition of an extra reaction step should always lead to a better fit of the model. A so-called successive F-Test can be employed to check whether the additional step results in a significant improvement.
Degrees of freedom
This value is calculated as the difference between the number of experimental data points of a measurement and the number of parameters in the calculated model curve.
Details see, for example in https://en.wikipedia.org/wiki/Degrees_of_freedom_(statistics)