Model-Free: ASTM E2890
This method is only for points at maximum conversion rate, and only for at least two dynamic measurements with positive heating rate.
The determination of the activation energy is using peak maxima points of curves without assumption about the reaction type.
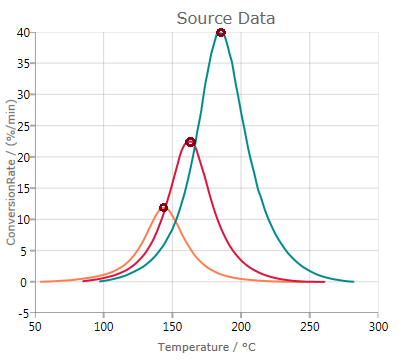
The analysis according to ASTM E2890 is based on the assumption that the maximum (for example maximum of the DSC or DTG curve) of a single step reaction is reached at the same degree of conversion independent on the heating rate.
Analysis
Analysis shows a graphic of Log(HeatingRate/ Tmax2) vs. inverse temperatures of maximum points Tmax. A linear dependence is observed:
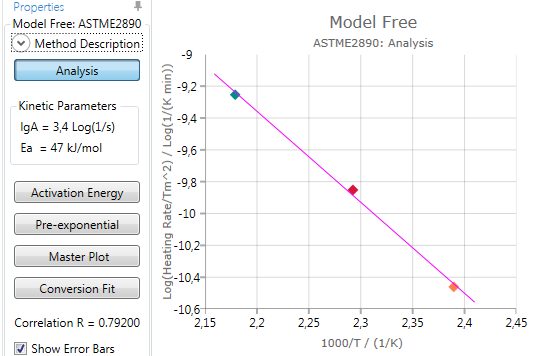
Activation energy and pre-exponential results are found from the slope and intersect of the linear fit.
The calculated Correlation R is explained in section Statistics.
Activation Energy
Pressing
![]()
shows the calculated activation energy including error bar – if the checkbox Show Error Bars is activated:
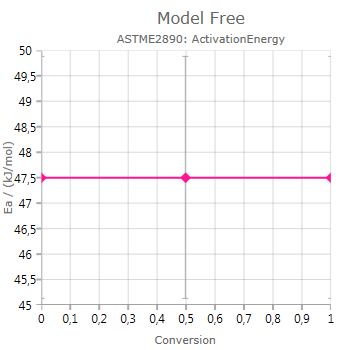
The activation energy is found for one point and is assumed to be constant for the entire conversion range.
Pre-Exponential Factor
Pressing
![]()
shows the calculated pre-exponential including error bar – if the checkbox Show Error Bars is activated:
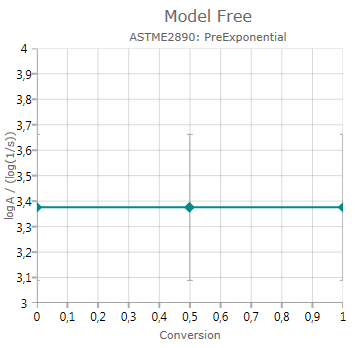
The pre-exponential is found for one point and is assumed to be constant for the entire conversion range.
The chart presents decimal logarithm of pre-exponential factor.
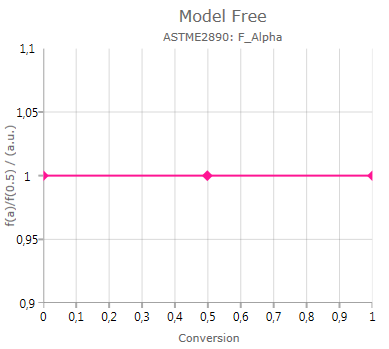
Master Plot
Pressing
![]()
shows the calculated ratio f(α)/f(0.5):
Conversion Fit
Pressing
![]()
shows experimental and simulated values, where the simulation is done based on the results of the ASTM E2890 analysis:
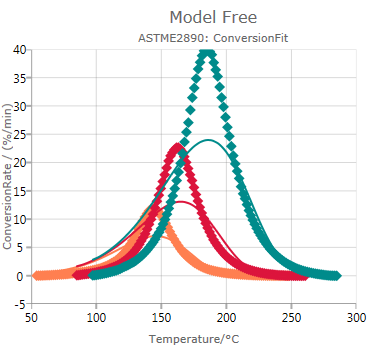
In this case, the mismatch between data and simulated values indicates that the analysis according to ASTM E2890 might not be reliable. Maximum points have the same temperatures for experimental and simulated curves, respectively.
Disadvantages
Disadvantages of this method:
-
only for one-step reactions, for complex reactions the points are not on a straight line
-
only for dynamic measurements
-
only one point is evaluated, all other information is not used