Model-Free: ASTM E2070
The model-free analysis according to ASTM E2070 is an isoconversional method only for isothermal data. At least two measurements at different isothermal temperatures are required, four measurements are recommended.
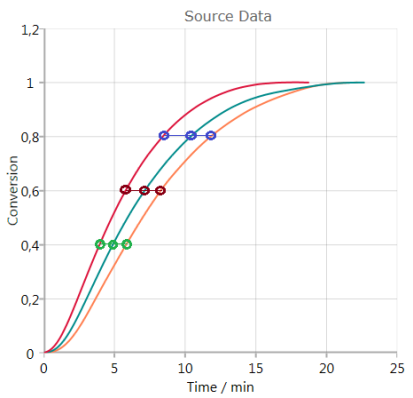
The determination of the activation energy is using the points at the same conversion (0.01, 0.02, …, 0.99, 1.00) from the measurements at different isothermal temperatures. There is no assumption about the reaction type. In this example, conversion data for the isothermal crystallization of a polymer are shown, where the crystallization process is faster the lower the temperature is (103.5°C: orange; 103.0°C: cyan; 102.5°C: red).
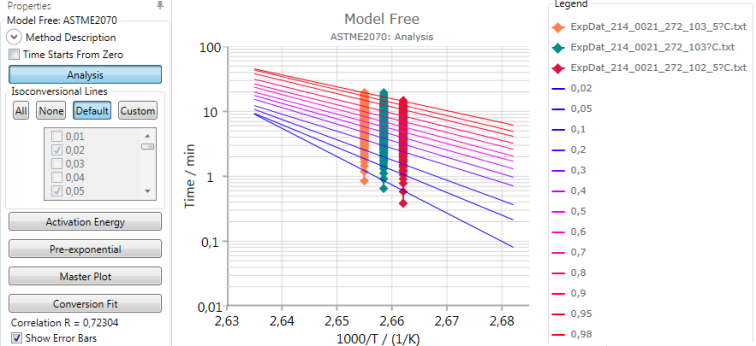
Analysis
Analysis shows a graphic of Log(Time to conversion) vs. inverse temperatures of the points at the same conversions. Linear fit curves are shown for each conversion value specified:
Time Starts from Zero should be checked if the reactions in the different source data used start at different times (for example due to different heating segments before the isothermal segment where the reaction takes place). If Time Starts from Zero is checked, the times of all source data used are shifted, so that the reactions always start from zero.
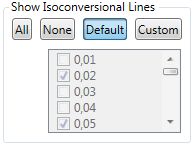
Any of these isoconversional lines can be shown by selecting All, None, Default or Custom:
Activation Energy and Pre-exponential results are found from the slope and intersect of these linear fits. For calculation of the Pre-exponential, a first order reaction is assumed.
The calculated Correlation R is explained in section Statistics.
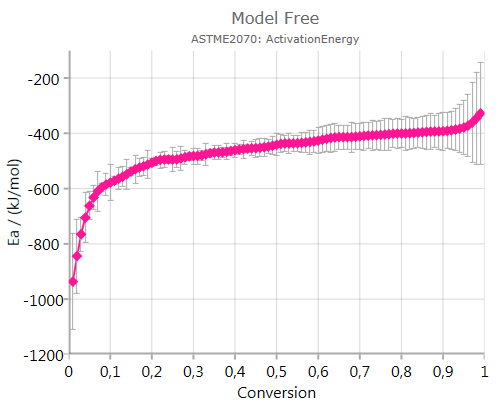
Activation Energy
Pressing
![]()
shows the calculated activation energy including error bar – if the checkbox Show Error Bars is activated:
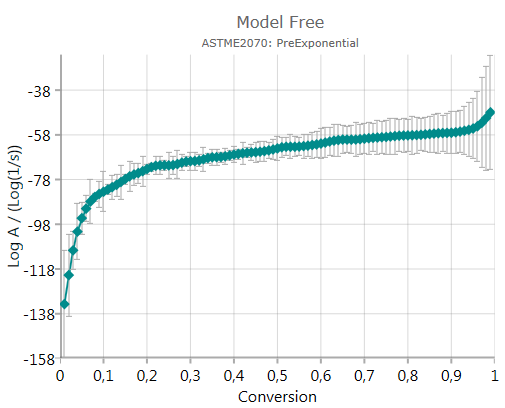
Pre-Exponential Factor
Pressing
![]()
shows the calculated pre-exponential including error bar – if activated.
The chart presents decimal logarithm of pre-exponential factor.
Master Plot
Pressing
![]()
shows the calculated ratio f(α)/f(0.5):
The ratio f(α)/f(0.5) is useful for the graphical estimation of the reaction type for single-step processes.
Conversion Fit
Pressing
![]()
shows experimental and simulated values, where the simulation is done based on the results of the Friedman analysis:
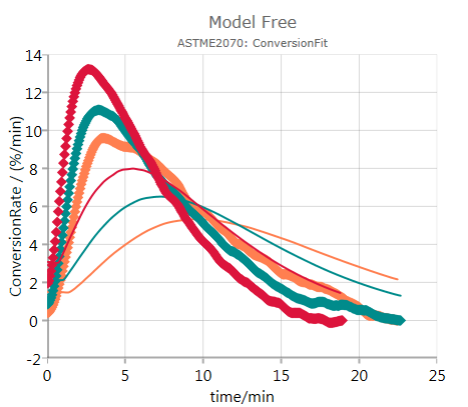
In this case, the mismatch between data and simulated values indicates that the analysis according to ASTM E2070 might not be reliable.
Advantages
Advantages of this method:
- Each reaction point is evaluated
Disadvantages
Disadvantages of this method:
- only for one-step reactions. For complex reactions, the points are not on a straight line
- only for a set of several isothermal measurements