Predictions: Time Temperature Transition (TTT)
The TTT diagram is only possible for projects of type DSC or DSC Curing. Predictions of the glass transition temperatures can be made for different isothermal temperatures where the X axis is always the time or Log(time) and the Y axis always the temperature. Isoconversion curves can furthermore be displayed (see below).
First, a Method/Model (model-free or model-based) needs to be selected (here: Friedman), where only those models are offered with which the data was already analyzed.
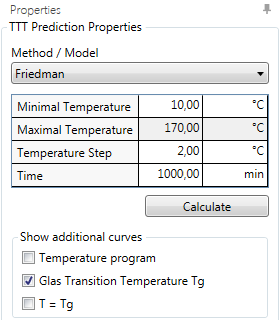
- The Minimal and Maximal Temperatures define the minimum and maximum isothermal temperatures.
- Temperature Step defines the difference between each isothermal temperature.
- Time is the maximum time of the simulation.
Default values are suggested by the software according to the experimental data.
Show Temperature program for displaying the different isothermal temperatures in the plot.
Glass Transition Temperature Tg for displaying the glass transition curves in the plot.
T = Tg shows the so called vitrification curve where the sample temperature is equal to the glass transition temperature.
Press Calculate for calculations/update of calculations.
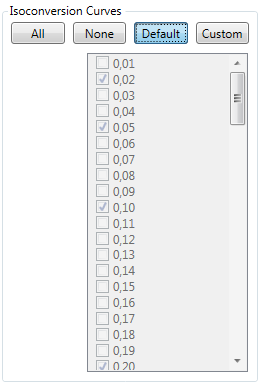
Which Isoconversion Curves are shown can be customized by selecting All, None, Default or Custom:
Exemplary Result:
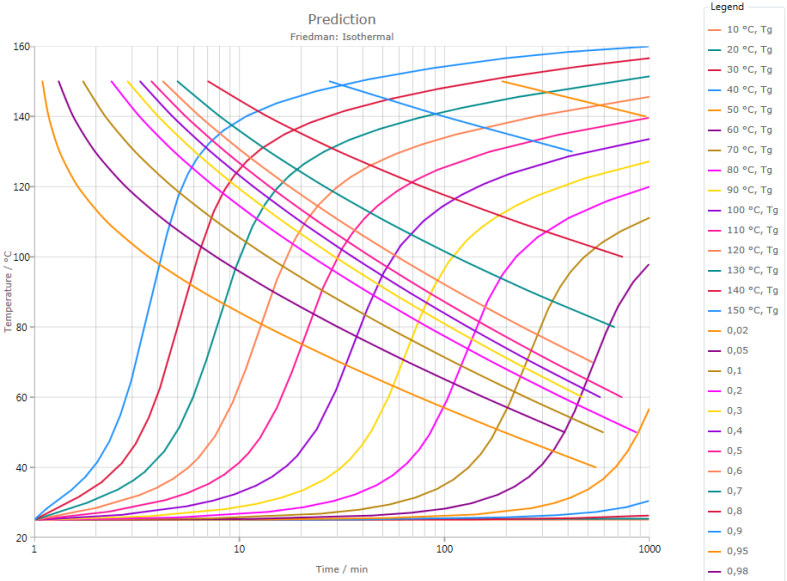
The increasing curves are the simulated glass transition temperatures as a function of time, the decreasing curves are the simulated isoconversion curves.
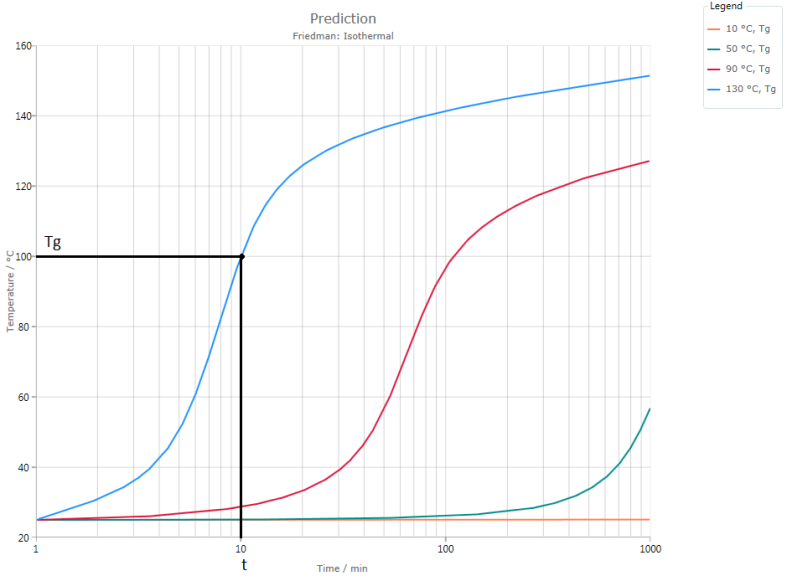
For example, at an isothermal reaction temperature of 130°C, the sample will have a glass transition temperature Tg of 100°C after a reaction time t of 10 minutes:
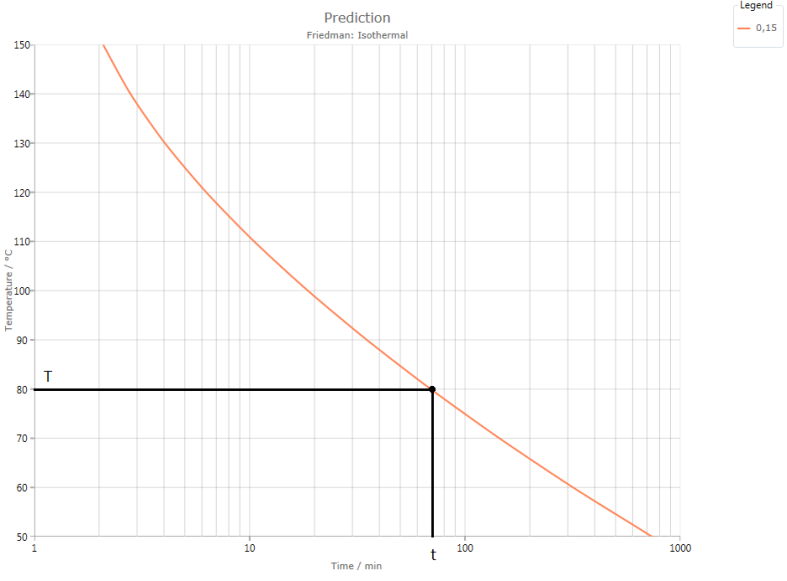
Isoconversion Curves are T-t-curves at the same conversion. For example, at an isothermal temperature T of 80°C, a conversion of 0.15 will be achieved after a reaction time t of 70 minutes:
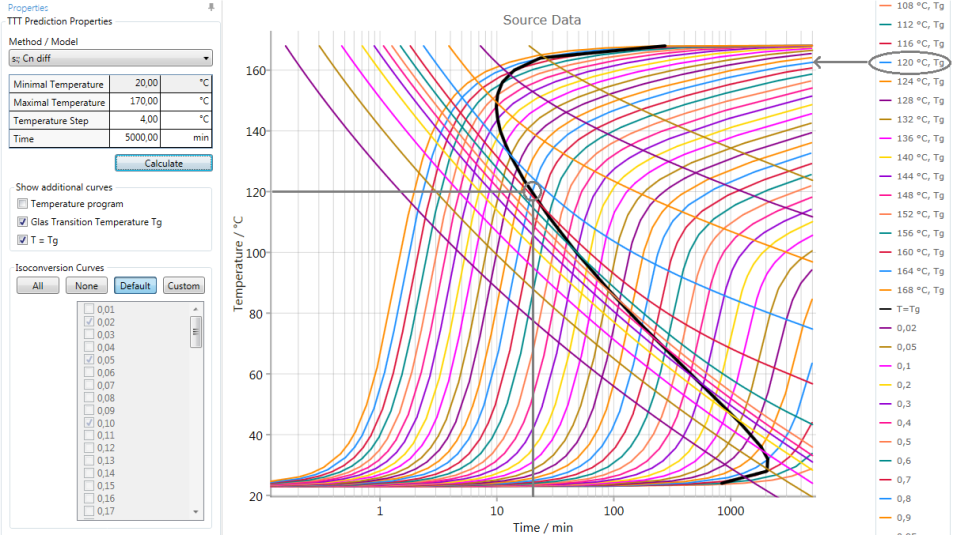
In the following example T=Tg was checked so that the black, so called vitrification curve is displayed. It shows where the sample temperature T is equal to the glass transition temperature Tg. For instance, during isothermal curing at 120°C, the glass transition temperature changes from its minimal temperature (about 25°C) to its maximum temperature (about 165°C) as shown by the indicated blue curve. At 20 minutes, the glass transition temperature Tg is equal to the sample temperature T. The black vitrification curve, which represents points where T=Tgat different isothermal temperatures, divides the diagram into two parts: Rubby state (left from the vitrification curve) and glassy state (right from the vitrification curve).
Customization and exporting of the results can be done via Ribbon Toolbar.