Predictions: Dynamic (including glass transition temperatures)
Predictions of the signal, conversion, conversion rate, concentration or reaction rate can be made for different constant heating rates. For projects of type DSC Curing, the glass transition temperature can also be predicted - if the Glass Transition Data was defined.
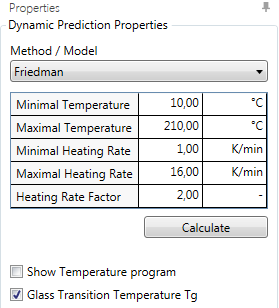
First, a Method/Model (model-free or model-based) needs to be selected (here: Friedman), where only those models are offered with which the data were already analyzed.
- The Minimal and Maximal Temperatures define the minimum and maximum temperatures of the predictions in °C.
- Minimal and Maximal Heating Rate define the minimum and maximum heating rates in K/min.
- Heating Rate Factor is the ratio between each neighboring heating rate.
Default values are suggested by the software according to the experimental data.
Show Temperature program can only be activated if the X-axis unit is set to time.
Glass Transition Temperature Tg can only be activated if the X-axis unit is set to time.
Press Calculate for calculations/update of calculations.
Exemplary results:
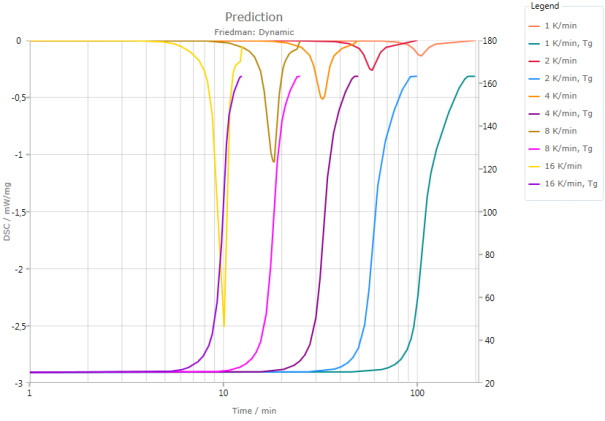
In this example, various simulated DSC signal curves for different heating rates are shown as a function of time. The corresponding glass transition temperatures Tg are furthermore displayed.
Customization and exporting of the results can be done via Ribbon Toolbar.