Predictions: Adiabatic24
Adiabatic predictions with pre-defined time to maximum reaction rate (e.g. 24 hours). Also known in literature as TD24 or TMR24.
Adiabatic predictions of the signal, conversion, conversion rate, concentration or reaction rate can be made for pre-defined time to maximum reaction rate. This is the most important criterion of safety and it is necessary for estimation of thermal risks. Adiabatic predictions are useful if the measurements are of type DSC or ARC.
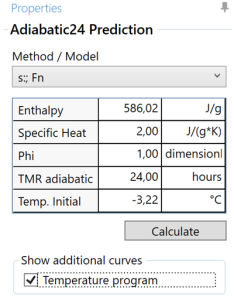
First, a Method/Model (model-free or model-based) needs to be selected (here: Fn), where only those models are offered with which the data were already analyzed.
- Enthalpy [J/g] is the enthalpy of total chemical reaction. For DSC, it is calculated from the area under the peak. For DSC projects, the enthalpy is determined automatically from the loaded measurements. For other project types, it must be entered by the user.
- Specific Heat [J/(g*K)] is the specific heat capacity of the material. If it changed during the reaction, then it is recommended to use the value at the initial temperature.
- Phi [dimensionless] is the so-called phi factor equal to Ф= (ms·cps+ mc·cpc)/(ms·cps). Here m means mass, cp means specific heat, subindexs refers to the sample, and subindexc refers to the container. Value Ф is bigger or equal to 1.
- TMR adiabatic [hours] is the pre-defined time to maximum rate, for which the initial temperature should be found. Usually 24 hours. However, sometimes the values of 6,8 and 12 hours are also used.
- Temp. initial [°C] is the initial temperature for searching. It should be not too far (usually not more than by 50 °C) from the expected temperature for pre-defined TMR.
Click on Calculate button will start the searching procedure and find the exact value of the initial temperature in order to achieve the desired TMR. For very complex reactions containing several exothermal and endothermal peaks it is recommended to use Adiabatic predictions instead of Adiabatic24.
Temperature program, which can be enabled for time as x-axis, shows the adiabatic increase of the temperature. Using the AutoZoom tool from Ribbon Toolbar allows for seeing the temperature separately.
Exemplary results:
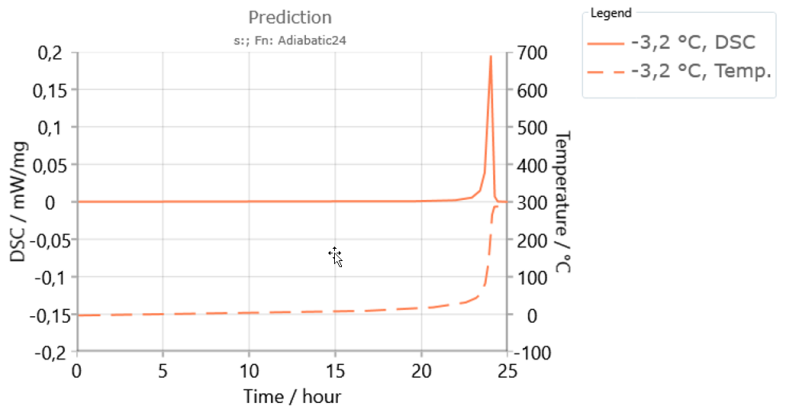
In this example the simulated signal curve is shown together with the simulated temperature curve as a function of time for TMR=24 hours. The legend contains the initial temperature for this simulation.
Customization and exporting of the results can be done via Ribbon Toolbar.