Optimization: Signal Rate
The aim is to simulate data exhibiting a defined constant signal rate. This can be achieved via optimization of the temperature profile where the following boundary conditions should be fulfilled:
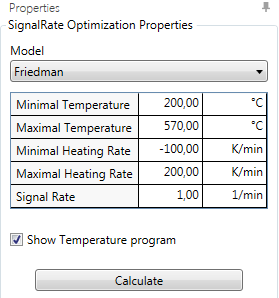
First, a Method/Model (model-free or model-based) needs to be selected (here: Friedman), where only those models are offered with which the data were already analyzed.
- The Minimal and Maximal Temperatures define the minimum and maximum temperatures of the calculations.
- Minimal and Maximal Heating Rateare the minimum and maximum heating rates which are allowed for the calculations.
- Signal Rate is the target value of the signal rate that should be kept as constant as possible during the calculations.
Default values are suggested by the software according to the experimental data.
Show Temperature program can only be activated if the X-axis unit is set to time.
Press Calculate for calculations/update of calculations.
Exemplary results:
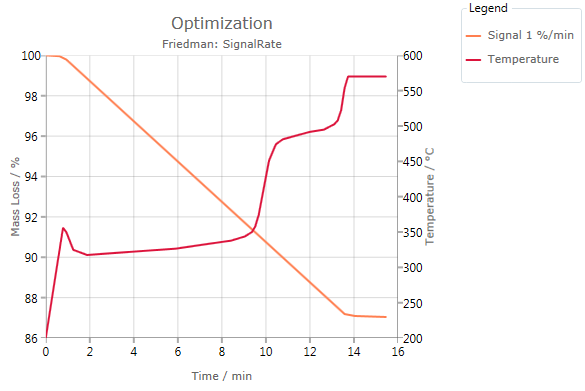
In this example, the optimized signal curve and the corresponding temperature profile are shown as a function of time. For TG, the signal rate is measured in %/min, where % is the percentage of the mass loss. In this example, the total mass loss is ~13% resulting in a duration of the reaction of about 13 minutes, because the parameter signal rate was set to 1%/min (see above).
For DSC, the signal rate is the same as the conversion rate. For a signal rate of 1%/min, the duration of the DSC reaction would be 100 minutes.
Customization and exporting of the results can be done via Ribbon Toolbar.