Optimization: Conversion Values
The aim is to simulate data exhibiting a user-defined conversion behavior:
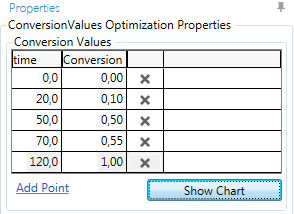
Add Point is used for inserting further conversion values between 0…1, which should increase monotonically as a function of time.
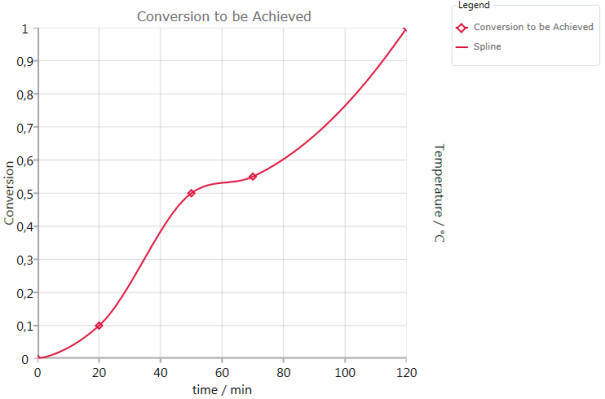
Show Chart displays the conversion values to be achieved together with a calculated spline curve:
The simulation is done via optimization of the temperature profile, where boundary conditions should be fulfilled:
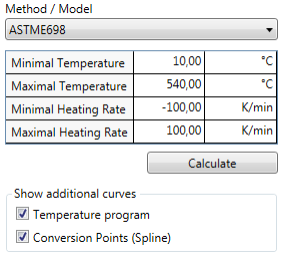
First, a Method/Model (model-free or model-based) needs to be selected (here: ASTM E698), where only those models are offered with which the data were already analyzed.
- The Minimal and Maximal Temperatures define the minimum and maximum temperatures of the calculations.
- Minimal and Maximal Heating Ratedefine the minimum and maximum heating rates which are allowed for the calculations.
Temperature program can only be shown if the X-axis unit is set to time.
Conversion Points (Spline) is for displaying the spline curve through the conversion values.
Press Calculate for calculations/update of calculations.
Exemplary results:
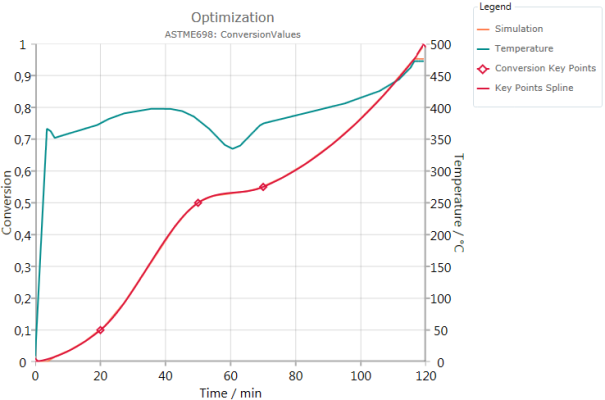
Shown in this example are the target conversion curve (key points and spline, red), the simulated conversion curve (orange) and the corresponding temperature profile (cyan) as a function of time. Target and simulated conversion curves are almost identical in this case.
Customization and exporting of the results can be done via Ribbon Toolbar.